A move from 21% to 24% awareness can still be inconclusive when the survey has a five-percentage-point margin of error, as illustrated in SurveyMonkey's brand awareness guidance. More people reached doesn't necessarily mean more people remember the brand. Even a higher survey score needs an uncertainty check before anyone calls it progress.
The practical answer to how to measure brand awareness is to track unaided recall and aided recognition, pair them with branded search demand, and use a randomized holdout when campaign attribution matters. For creators, agencies, developers, and small teams managing several social accounts, that separates remembered brands from merely distributed content.
Table of Contents
- Brand Awareness Metrics and What Each One Tells You
- How to Run a Survey That Measures Recall
- Behavioral Signals to Track Alongside Surveys
- How to Prove a Campaign Lifted Awareness
- Common Mistakes and How to Fix Them
- Set Your Baseline and Track It Every Quarter
Brand Awareness Metrics and What Each One Tells You
Brand awareness metrics, formulas and data sources
| Metric | What it measures | How to calculate | Data source |
|---|---|---|---|
| Unaided awareness | Brands named with no prompt | Respondents naming the brand divided by qualified respondents, times 100 | Survey |
| Aided awareness | Brands recognized from a randomized list | Respondents recognizing the brand divided by qualified respondents, times 100 | Survey |
| Awareness conversion | How much recognition turns into recall | Unaided percentage divided by aided percentage, times 100 | Survey results |
| Branded search impressions | Demand for the brand's name in search | Impressions for queries containing brand terms, compared with the same period last year | Search Console |
| Brand lift | Estimated campaign-caused change | Exposed group percentage minus control group percentage | Holdout survey |
| Mentions and share of voice | Conversation volume against competitors | Count brand mentions; divide by total category mentions for share | Social listening tool |
Calculate memory before interpreting activity
The denominator matters. Qualified respondents are people in the defined target market, not everyone who opened the questionnaire. The TEM Journal review of brand awareness distinguishes recognition from recall and supports calculating awareness as respondents naming or recognizing the brand divided by qualified respondents, multiplied by 100.
Keep top-of-mind awareness as a separate diagnostic: it records the brand named first. A brand can appear somewhere in an unaided answer without being the first option that comes to mind.
Awareness conversion compares spontaneous retrieval with prompted familiarity. In SurveyMonkey's brand recall example, 24% unaided awareness divided by 60% aided awareness, multiplied by 100, equals 40% conversion. That's a diagnostic ratio, not proof that particular respondents moved through a funnel.
A wide recognition-to-recall gap suggests that exposure has made the name familiar without making it easy to retrieve. That points toward clearer category associations, rather than buying more distribution.
Keep distribution in a separate dashboard column
Reach, impressions, and follower counts belong beside memory measures, not inside a blended awareness score. Riff Analytics' guide to how to measure brand reach provides useful context for the exposure side. A separate social media KPI framework helps keep distribution, engagement, and business outcomes labeled consistently.
Lean-budget rule: Start with unaided and aided awareness in the same survey, then add branded search impressions. A small, repeatable system is more useful than an elaborate dashboard with changing definitions.
How to Run a Survey That Measures Recall
A clean survey wave starts with a frozen questionnaire, not a campaign report. Sprig's brand-tracking guide recommends tracking unaided and aided awareness together while holding the category, audience, wording, and competitor set consistent.
The process should remain recognizable from setup through reporting.
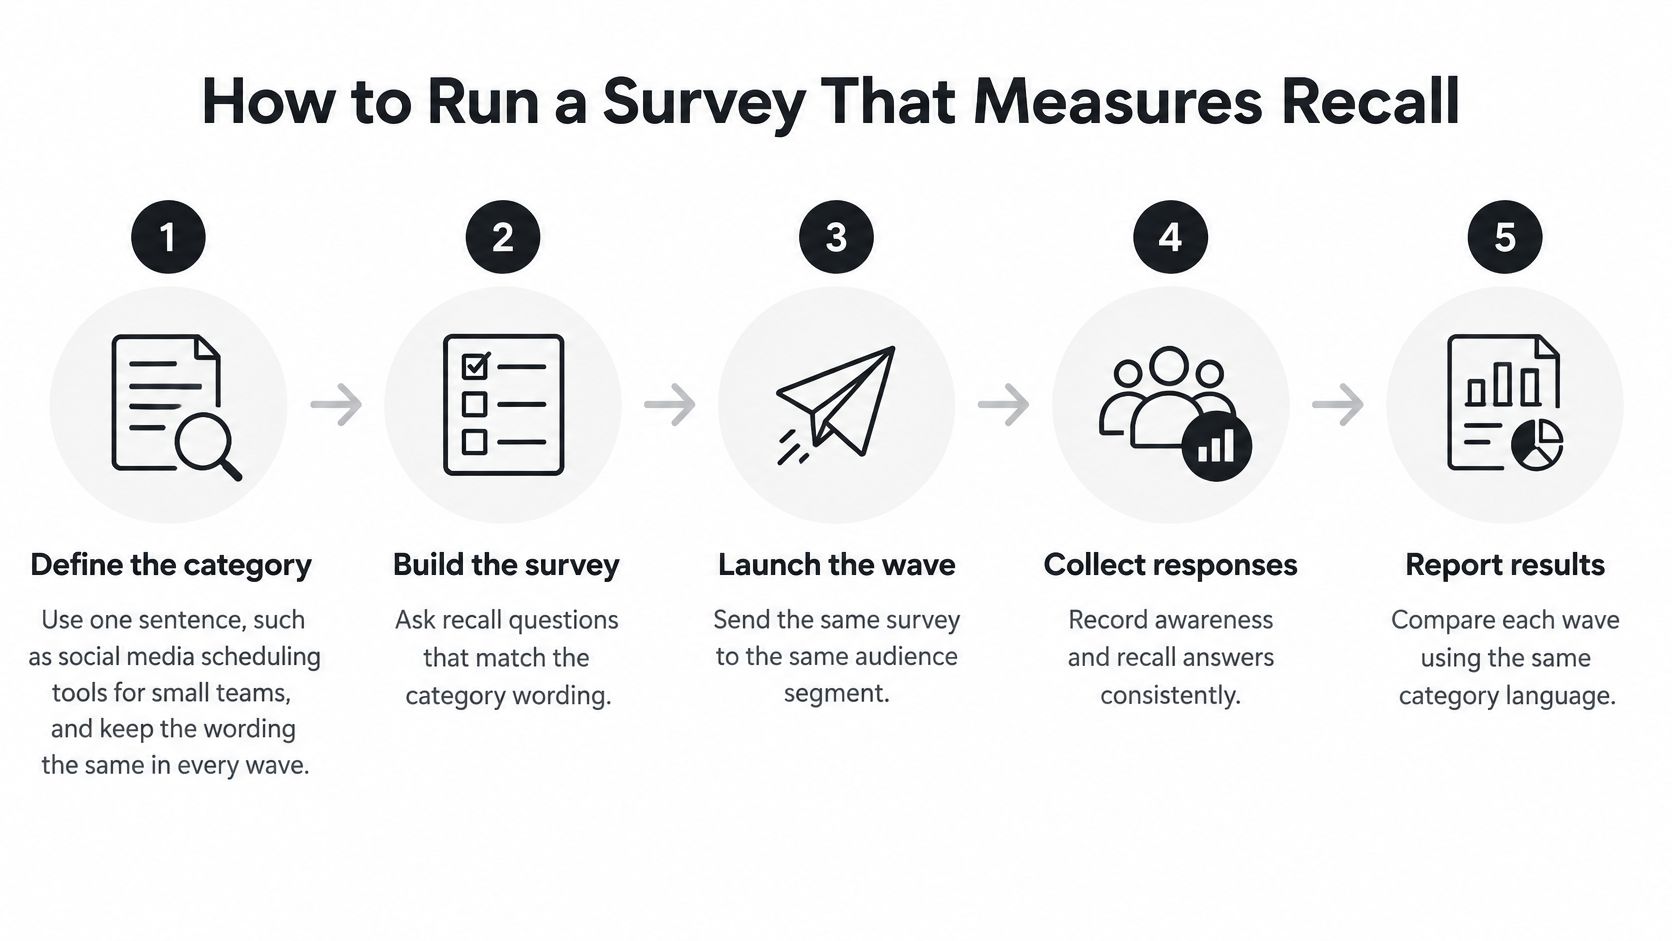
Build a repeatable survey wave
Define the category. Use a sentence such as social media scheduling tools for small teams. Broadening it to marketing software in the next wave changes the task respondents are answering.
Freeze the competitor list. Choose relevant alternatives before fieldwork and randomize their display order. Adding a fashionable competitor halfway through collection creates inconsistent questionnaires.
Ask unaided recall first. Ask respondents which brands come to mind for the category without displaying names or logos. Showing the list first supplies memory cues and contaminates spontaneous recall.
Then measure aided recognition. Present the randomized list and ask which brands respondents recognize or have heard of. Don't substitute a preference question, because liking a brand isn't the same as recognizing it.
Screen the audience. Recruit people who buy or influence purchases in the category, using the same eligibility rules each time. Surveying only current followers creates a different population from the addressable market.
Set the fieldwork plan. Specify the qualified sample target, collection window, and recruitment method before launch. Avoid stopping collection early because an encouraging result appears.
Calculate and inspect. Report recall, recognition, and awareness conversion using the qualified base. Preserve open-text answers and establish coding rules for misspellings, product names, and ambiguous responses.
Publish the method with the result. Include sample size, target market, field dates, exact wording, uncertainty, competitors, and the previous wave. A percentage without that context is difficult to audit.
Formbricks' sample brand awareness survey items can help draft the questionnaire. Adapt the language before the baseline, then resist unnecessary edits.
Check precision and understanding before launch
For a hypothetical simple random sample of 400 qualified respondents, the standard proportion calculation gives an approximate 95% margin of 4.9 percentage points near 50%, or 4 points near 21%. These are calculated examples, not a promise about an opt-in panel; weighting and recruitment can change uncertainty.
A hypothetical rise from 21% to 24% at that sample size wouldn't establish a statistically reliable increase. In addition, significance requires checking the uncertainty of the difference between waves, not merely whether the change exceeds one wave's margin.
After aided recognition, add an open question asking what the brand offers and whom it serves. Code correct, incorrect, and unclear associations separately, so name recognition doesn't conceal a positioning problem.
Behavioral Signals to Track Alongside Surveys
Behavioral signals reveal actions around the brand. They don't replace a direct test of memory, but they help identify which changes deserve investigation.
A useful dashboard keeps each signal's definition visible.
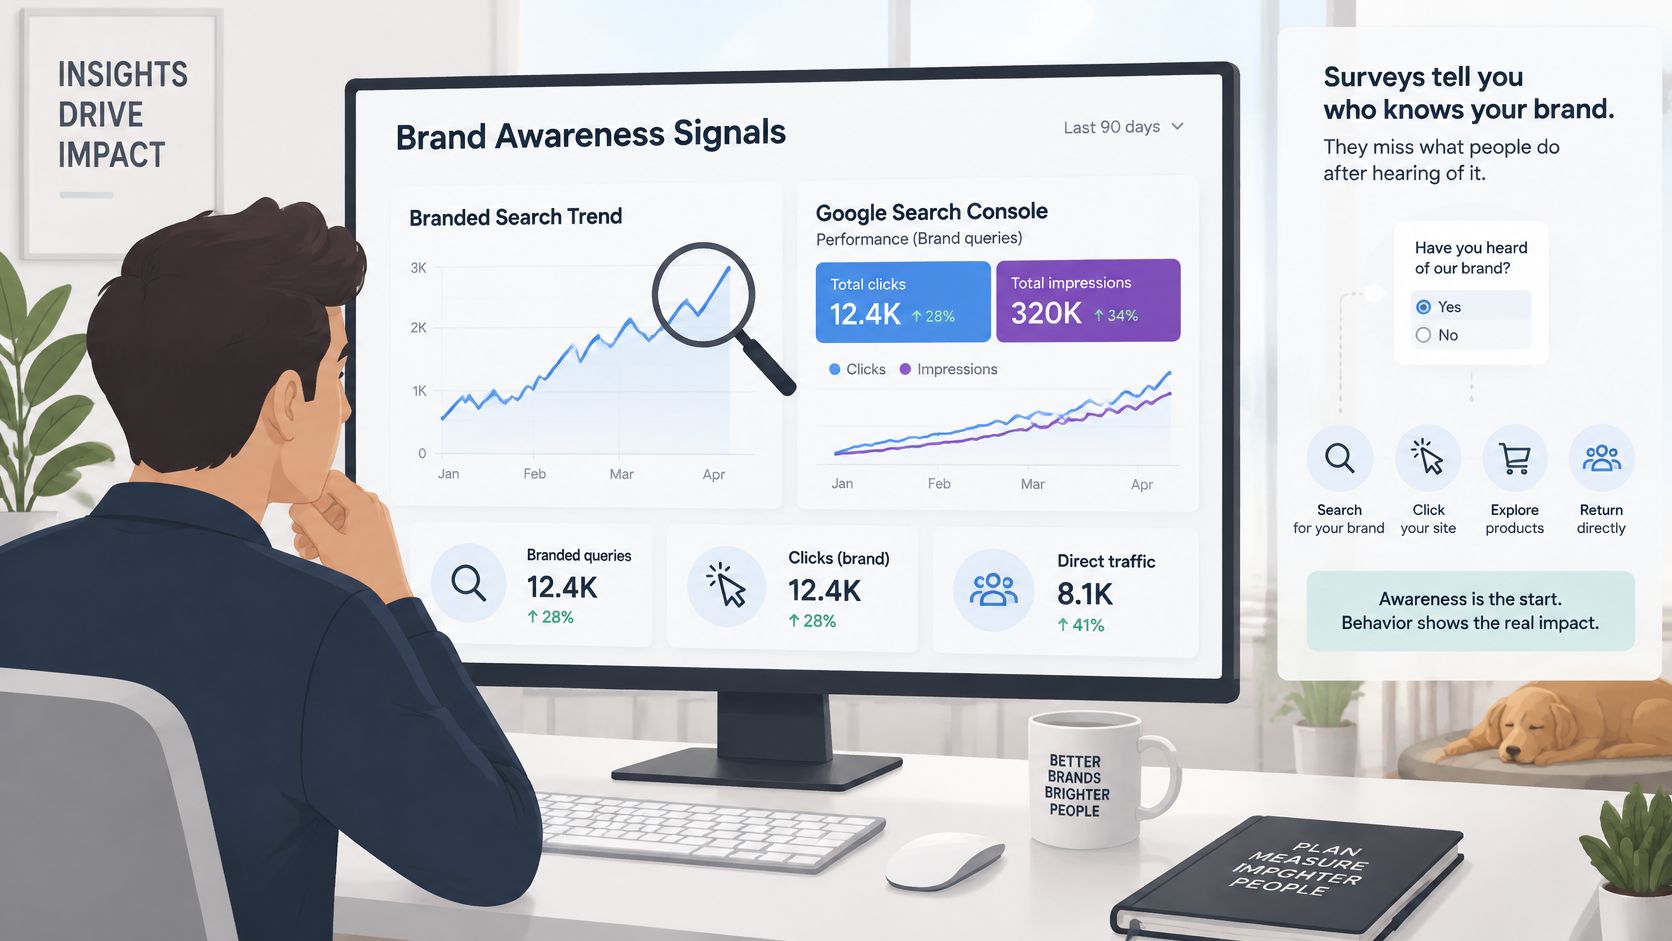
Separate search demand from website visits
In Google Search Console, filter the Performance report for the brand name, product names, and common misspellings. Search Engine Land's branded-search guidance recommends comparing the latest three months with the same period in the prior year to reduce seasonal distortion.
Impressions record appearances in branded search results. Clicks also depend on rankings, snippets, competing results, and answers that don't require a visit. Break results out by country, device, and query group where possible.
Behavioral signals, what they show and how to check them
| Signal | What it can show | What it cannot prove | Check before crediting a change |
|---|---|---|---|
| Branded search impressions | Demand for the name in Google results | New people or campaign cause | Compare equivalent seasonal periods and pair with a survey wave |
| Direct traffic | Visits with no referring source | New awareness, since repeat visits, bookmarks, and typed URLs contribute | Trend against survey waves, never alone |
| Mention volume and share of voice | Conversation about the brand against competitors | Unique audience reach or remembered exposure | Divide brand mentions by total category mentions using consistent monthly coverage |
| AI assistant mention rate | How often assistants name the brand for fixed prompts | Memory or recall among people | Same prompts, assistants, and settings every wave |
Each network provides a slightly different set of metrics, and the FoPost dashboard shows what each network reports. A follower count on one network shouldn't be compared with reach on another; a consistent social media analytics workflow should preserve those labels.
The accompanying video offers another format for reviewing awareness measurement.
Audit AI discovery without calling it recall
Create a working set of 20 to 30 buyer questions, treated as a practical test design rather than a validated sample size. Include questions about multi-network scheduling, agent-controlled posting, API publishing, and analytics.
Following HubSpot's AI visibility guidance, log brand appearances, description accuracy, competitor substitutions, and cited sources. Calculate mention rate as answers mentioning the brand divided by answers analyzed, multiplied by 100, and record assistant version, location, language, and date.
An assistant describing the wrong use case isn't a visibility win, even when the brand appears prominently.
Say branded impressions rise after a podcast campaign. Check the next recall wave before crediting the podcast, and apply the same discipline to increased AI mentions.
How to Prove a Campaign Lifted Awareness
A before-and-after comparison can establish that awareness changed. It can't, by itself, establish that the campaign caused the change. Competitor activity, publicity, and other marketing may have occurred during the same period.
A randomized holdout study provides a stronger counterfactual: what would have happened among comparable eligible people without the campaign?
The design starts before any ads run.
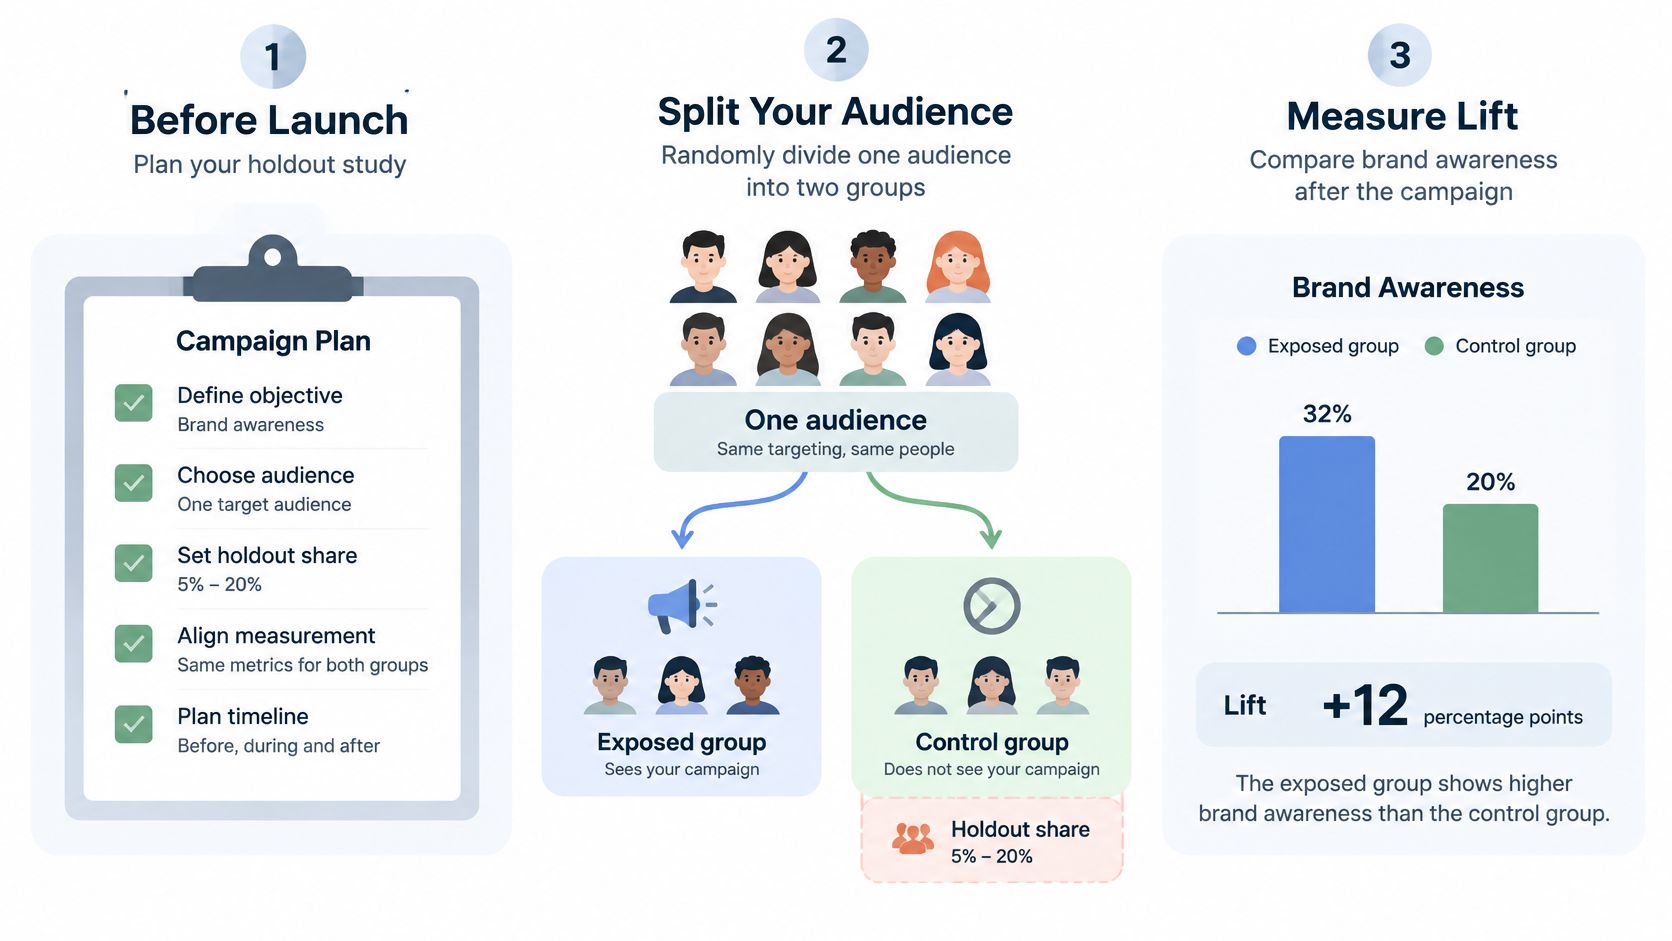
Set the comparison before launch
- Randomize eligible people. Assign an exposed group that can receive the campaign and a control group that won't. Sprig's advertising-effectiveness guide describes 5% to 20% as a commonly used control allocation, while noting that required sample size depends on the smallest detectable lift.
- Lock the holdout. Fix the allocation before launch. Moving people between groups after seeing results weakens the comparison.
- Keep measurement identical. Survey both groups in the same window, with unaided questions before the randomized aided list. Different wording creates a measurement difference alongside the exposure difference.
- Check feasibility first. Estimate the sample required for the smallest commercially meaningful effect. A tiny control group can make an otherwise sensible test inconclusive.
If preventing campaign delivery requires a replacement placement, use an unrelated placeholder for the control group. Add an ad recall question to assess memory of the creative itself, without treating that answer as a substitute for the randomized comparison.
Calculate absolute and relative lift
Consider a hypothetical result:
| Measure | Worked example |
|---|---|
| Exposed aided awareness | 30% |
| Control aided awareness | 24% |
| Absolute lift | 30% minus 24% = 6 percentage points |
| Relative lift | 6 divided by 24, multiplied by 100 = 25% |
These are illustrative inputs, not campaign findings. Percentage points and percent lift aren't interchangeable: the former expresses the gap between scores, while the latter scales that gap against the control result.
A credible report includes the baseline if collected, exposed and control results, absolute lift, relative lift, group sample sizes, field dates, and uncertainty. If the result is too imprecise, report it as inconclusive rather than evidence of no effect.
For campaign planning, the MyMentions guide to SaaS brand awareness can help organize the activities being tested. Keep the strategy document separate from the evidence used to judge causality.
Common Mistakes and How to Fix Them
The most common reporting error is presenting a large reach number as an awareness result. Webiano's brand-lift guide distinguishes exposure metrics from recall and recognition, and recommends reporting survey methods alongside campaign results.
A distribution success may be worth celebrating. It still needs the correct label.
Common awareness measurement mistakes and fixes
| Mistake | Why it misleads | Fix |
|---|---|---|
| Reach or impressions reported as awareness | Reach shows exposure, not memory | Report reach beside unaided recall and aided recognition |
| Small change reported as a win | Sampling variation can explain an apparent improvement | Test uncertainty in the difference and compare prior waves |
| Aided question asked first | A visible list cues respondents | Ask the unaided question first, every wave |
| Competitor list or wording changed | Different questions weaken comparability | Freeze both and note any forced change |
| No baseline before a campaign | A single wave cannot establish movement | Measure before launch and plan a holdout |
| Recognition treated as understanding | Familiarity can coexist with the wrong use case | Ask what the brand does and whom it serves |
Match the conclusion to the evidence
The table's fixes address different failure points. Reach inflation is an interpretation problem; question order is an instrument problem; changing competitors is a comparability problem. Combining them into a single dashboard score makes the underlying errors harder to detect.
A missing baseline also limits the story. A randomized campaign comparison can still estimate lift without a pre-campaign survey, but a lone post-campaign score cannot describe the brand's historical direction.
Incorrect associations deserve their own line in the report. For a developer-facing publishing product, recognition as a consumer photo editor wouldn't demonstrate useful category awareness. The team should inspect messaging and referral contexts before increasing promotion.
Reporting standard: Label a result as observed, statistically supported, or inconclusive. Don't turn a promising direction into a proven improvement.
Before declaring progress, check whether the difference is larger than expected sampling variation, whether recruitment and wording stayed comparable, and whether the movement persists against prior waves and competitors. A statistically credible rise can still be strategically weak if buyers remember the wrong thing.
Set Your Baseline and Track It Every Quarter
A lean tracking program needs a stable routine more than a crowded reporting stack. Assign an owner, keep the questionnaire versioned, and store the raw exports beside the dashboard.
Put the baseline on the calendar
- Freeze the market definition. Record the category sentence and named competitor set. A social media audit can organize the account and campaign inventory before measurement begins.
- Field the baseline. Run unaided and aided questions together. Choose the qualified sample from the precision needed, then record eligibility, sample size, field dates, and recruitment method.
- Schedule repeat waves. Use quarterly or semiannual tracking with the same audience criteria and questionnaire. Preserve comparable collection windows rather than surveying only after unusually successful campaigns.
- Maintain a monthly sheet. Log branded search impressions against the equivalent month last year, plus direct traffic and mentions. Keep campaign dates beside those trends.
- Plan campaign attribution early. Decide whether a holdout is feasible before buying distribution, not after the results arrive.
Post analytics cover every post published or tracked through the FoPost platform. Those records belong in the distribution and content-performance portion of the report; brand surveys still require a separate survey tool.
The immediate action is to choose a dated fieldwork window this month and add it to the team calendar today.
FoPost connects an AI agent to social networks so the agent can plan, write, and schedule posts, with approval in one calendar before publishing. Teams can visit the platform to coordinate publishing and review post analytics alongside a separate brand-awareness tracker.