
You exported last week's posts from Instagram, LinkedIn, and YouTube, dropped them into one sheet, and the totals refuse to line up. One network reports reach. Another reports impressions. A third only counts a thumbnail after it has sat on screen. The sheet looks exact. It isn't.
That's the practical problem in how to track social media analytics when a small team runs several accounts. Treat every dashboard as an imperfect observation system. Write the metric definition, the date window, and the gaps beside the number before anyone treats it as a result.
You don't need more charts. You need one goal, three metrics, and a routine that still makes sense after a bad pull.
Pick the Metrics Each Goal Needs
Start with one goal per account, then keep three numbers that answer it. Awareness, engagement, traffic, and revenue don't share a scoreboard.
| Goal | Primary metric | Formula | Watch out for |
|---|---|---|---|
| Awareness | Reach | Unique accounts that saw the post | Impressions count repeat views, so they are always higher |
| Engagement | Engagement rate by reach | (likes + comments + shares + saves) / reach x 100 | Not interchangeable with engagement rate by followers |
| Audience growth | Follower change | Followers at end minus followers at start, same window | Follower removals and purges distort the trend |
| Traffic | Tagged link clicks | Clicks where the UTM source is the network | Results depend on consistent UTM naming |
| Revenue or leads | Conversions by social source | Conversions with a social source / sessions from social | Needs CRM linkage to be meaningful |
Split the work into three layers. Exposure is reach and impressions. Response is reactions, comments, shares, saves, and clicks. Outcomes are sign-ups, purchases, and qualified leads. A total on its own misleads. Say a post gets 10,000 engagements. On 1 million reach that is a 1% rate. On 100,000 reach it is 10%. Same headline, different result.
A systematic review of social media engagement measurement found no settled formula. Studies mix likes, comments, shares, tweets, impressions, reach, and follower counts, and they don't agree on the denominator. A companion review of analytic tools groups metrics into reach, audience analysis, aggregate activity, and engagement. Early teams counted page hits or posts by hand. Newer systems collect continuously, which makes an undefined rate easier to publish and harder to defend.
Write the formula, the window, the platform, and whether paid and organic are combined next to every rate. Engagement rate by reach and engagement rate by followers answer different questions. For a fuller map of which KPI belongs in a stakeholder report, Sift AI's guide to defining KPIs for social media reporting is a useful cross-check before you lock the sheet.
Set a target and a review date for each row. The table then forces a decision instead of collecting vanity totals.
Pull Native Numbers From Each Platform
Pull each network's own labels before you add anything together. Set one window for every export, such as the last 28 days in UTC, and don't mix time zones inside that pull.
| Platform | Native metric to pull | Where to find it | Limit to note |
|---|---|---|---|
| Accounts engaged, reach, follower count | Professional dashboard Insights | Demographics need more than 100 engaged accounts; try a 30 or 90 day range | |
| YouTube | Impressions, impressions click-through rate, watch time | YouTube Studio Analytics | An impression needs the thumbnail visible over one second, with at least 50% on screen |
| Impressions, clicks, reactions, reposts | Post analytics for each post | Impressions are not reach; compare only with other LinkedIn posts | |
| Reach, post engagements, link clicks | Insights in Meta Business Suite | Confirm label definitions in current help pages before comparing with Instagram |
Two comparisons that break first
Instagram splits audience size from interaction. Instagram's Insights documentation defines Accounts engaged as unique accounts that interacted with content. Demographics, including top countries, cities, age ranges, and gender, appear only after more than 100 accounts engage. A seven-day view with no demographics isn't a bug. Switch the preset to 30 or 90 days, and keep reach separate from engaged accounts.
YouTube is stricter about what counts as seen. YouTube's impressions help page counts a thumbnail impression only when the thumbnail is visible for more than one second and at least 50% of it is on screen. Read impressions click-through rate next to watch time. A high click-through rate with short watch time means the thumbnail won the click and the video lost the viewer.
On LinkedIn and Facebook, copy impressions or reach, clicks, and engagements exactly as labeled, and note any definition change in the export filename. Save the raw file before you rename a column. Later corrections are impossible if the original labels are already gone.
Practical rule: If two networks don't share a denominator, don't put their rates in the same ranking.
Pull Analytics Through APIs When Exports Fall Short
Manual exports hold up for a few accounts. They fall apart when the same pull has to run every week.
- Register an app on each network and request only the read scopes your metric table needs. Note scope limits before you design the pipeline.
- Store access tokens outside the code and refresh them before they expire. A silent expiry looks like a quiet week.
- Request only the fields named in the metric table. For each call, log the endpoint, API version, query, timestamp, account scope, date range, pagination state, and fields returned.
- Back off with a longer delay after each rate-limit failure. Record the time and the network so the gap stays visible in the report.
- Before you trust the job, compare one day and one post with the native dashboard. Totals that drift past a small margin usually mean the range, time zone, or filter doesn't match.
- Normalize responses into one table keyed by platform, post ID, and pull date, and keep the raw payload beside it.
If the team already publishes through an API, read the current FoPost analytics API docs and confirm which endpoints exist before the pipeline depends on them. The Analytics API returns the same numbers as the dashboard, which makes that native-versus-API check a same-day task instead of a second export.
How to Tag Links So Traffic Stays Traceable
Most split reports start with two spellings of one network. insta and instagram each hold half the clicks, and both look weak.
Write the naming sheet before the next post goes out. Google's campaign URL guidance recommends utm_id, utm_source, utm_medium, and utm_campaign on destination URLs for non-Google campaigns. Give each platform its own source, such as fb and insta, instead of dumping every network into one source. After a click, those values show up in traffic-acquisition reports, but only if the names stay fixed.
| Parameter | What to enter | Example |
|---|---|---|
| utm_source | Network, one lowercase value per platform | fb, insta, linkedin |
| utm_medium | Channel type, same value for all social links | social |
| utm_campaign | Initiative name, lowercase, with hyphens | spring-launch-2026 |
| utm_content | Specific post or asset code | carousel-pricing-01 |
| utm_id | Optional campaign identifier, same value on every link in the initiative | 2026-spring-launch |
Build the link, then prove it
- Lock the medium: Use
socialon every social link so the networks can roll up without merging their sources. - Freeze the campaign:
spring-launch-2026stays that string until the initiative ends. A mid-flight rename creates a second campaign. - Code the asset:
carousel-pricing-01inutm_contentlets you compare formats without guessing from the post text. - Click once per network: Open the live URL and confirm the parameters in the acquisition report before the calendar fills up.
Tag bio links and newsletter links with the same sheet, or that traffic lands as direct. Shorteners and hop URLs often drop parameters. RedirHub's notes on how to pass UTM values through URL redirects show what to check before a redirect sits between the post and the site. A UTM generator keeps the casing consistent when several people build links in the same week.
How to Run a Weekly Tracking Routine
Run the review every Monday for the previous seven days. A fixed window stops last-minute posts from rewriting the story.
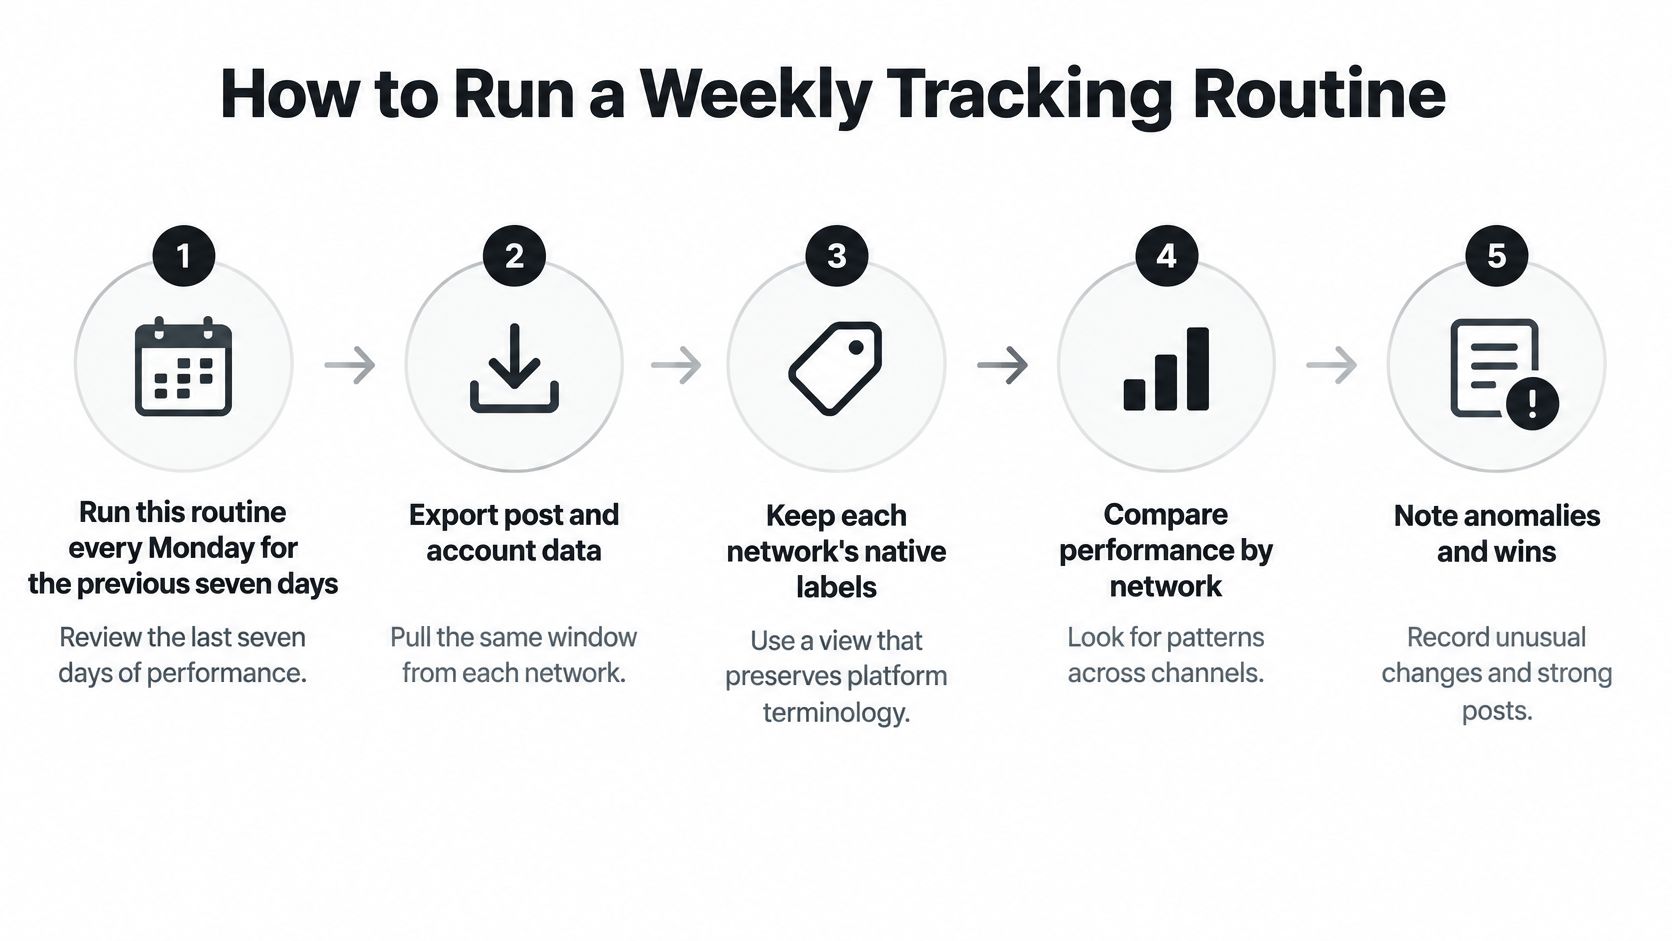
- Export post and account data for that same window, or open a view that keeps each network's native labels. Matching windows are what make Monday comparable to Monday.
- Filter to one account or one network at a time. A large account will hide a weak one if you only look at the combined total. Users can filter analytics to one network or one account, which is the right first cut.
- Calculate engagement rate by reach for each post. 1,200 interactions on 40,000 reach is 3.0 percent. Write the formula in the cell note so next month's reader doesn't invent a new one.
- Compare each post with the median for its own platform and format over the last eight weeks. A universal benchmark mixes incompatible denominators.
- Log platform, date range, formula, and export date on every row. The log is the audit trail when a stakeholder questions a spike.
- Mark the top three and bottom three posts. One sentence on why each landed there is enough. Topic, format, or timing, not a paragraph of theory.
- Change one thing next week, such as the opening line or the posting time, and hold the rest still. Two changes at once make the result unreadable.
FoPost can pull post and account analytics from connected networks into one workspace and export any view as a CSV for any date range. That removes most of the manual download when several accounts share a Monday slot. Any single post can also be refreshed on demand if a number still looks stale.
A weekly log with three winners, three losers, and one planned change beats a 40-metric dashboard nobody opens.
Why Your Numbers Disagree and How to Fix Them
The usual fight is a mismatched date range. Check causes in order, and stop at the first one that explains the gap.
| Symptom | Likely cause | Fix |
|---|---|---|
| Totals differ from the native app | Different date range or time zone | Match range and time zone, then compare once |
| Same post shows new counts on each pull | Metrics still refreshing | Wait a few days before logging, and record the pull date |
| Reach from one network compared with impressions from another | Metric definitions differ | Compare within a platform, or label the metric type |
| Engagement rate spikes for a small account | Small reach base | Use a longer window and report the reach base beside the rate |
| Clicks show as direct, not social | Missing or inconsistent UTM tags | Audit every link and correct the naming sheet |
| Posts missing from an export | Deleted posts, rate limits or access errors | Log the error and flag the gap in the report |
Work down the list
Background workers refresh post and account analytics on a schedule, within each network's limits. A post can keep moving for days after it goes live, so the pull date belongs beside the number.
History starts when an account is connected and only goes back as far as the network allows for account-level history. Older posts that look empty often were never in the extract.
Log the pull, then test coverage
For every extraction, record platform, endpoint, date range, filters, pagination state, and fields returned. Keep the raw response. Then compare API totals with the native dashboard, repeat the pull, and flag deleted posts.
Don't generalize a sample to a whole network. Independent API research notes that the historical Twitter free Streaming API was limited to about 1% of traffic and was not representative in many cases, and that platform sampling strategies are often undisclosed. Label coverage and the sampling frame next to any trend. If the question is whether those clicks became revenue, Cometly's walkthrough of how to measure ROI from social campaigns is a clear look at where last-click stories break.
Measure Impact When Clicks Miss Most of It
A lower attributed number often means measurement loss, not a weaker campaign. Tagged clicks miss zero-click exposure, dark social, offline purchases, brand search, and conversions that arrive after several untracked touches.

A 2025 survey of 1,200 marketing leaders in the United States, the United Kingdom, and Australia found that 56% believed social media drives revenue, yet only 44% rated their teams as expert at measuring business impact, according to Sprout Social's 2025 impact report. The same research points to unreliable attribution, weak stack integration, and thin CRM connectivity.
Four evidence sources, used together
- Ask at the point of conversion: Add "How did you hear about us?" to sign-up or checkout, and count answers that name a social network.
- Keep a CRM source field: Fill it on every lead so a social-sourced deal stays visible after the first session expires.
- Watch branded search: Track searches for the company name across the same weeks as the campaign.
- Hold one group out: Pause posting for one region or audience segment for two weeks, then compare conversion rates with the group that stayed active.
Report reach and engagement as descriptive metrics. Report extra demand as incremental impact. Platform attribution shows touchpoints. It doesn't prove cause.
The short walkthrough below shows why a last-click report undercounts demand that never produced a trackable click.
Confirm Your Baseline Before the Next Campaign
Build a 30-day baseline this week, before the next campaign goes live.
- Pick three goals and the primary metric for each from the goal table.
- Write the formula, window, and platform next to each metric in the log.
- Confirm every outbound link matches the naming sheet, and fix the ones that don't.
- Export the last 30 days from each connected network on the same range and time zone, and log the pull date. Any analytics view can be exported as a CSV for any date range, and post plus account analytics from every connected network can sit in one view.
- Calculate the median engagement rate by reach for each platform and format, using the Monday method.
- Set a review date four weeks out. Compare new posts with these medians, never with another network's rate.
Starting with FoPost is free, and every feature on the analytics page is included, so the baseline doesn't wait on a paid upgrade. Keep that sheet next to the weekly log. The first review then starts from known values.
FoPost schedules and publishes to major networks from one place, and it pulls reach, engagement, clicks, and follower change into a single analytics view you can filter and export. Use it to keep the weekly log and the 30-day baseline on the same definitions instead of rebuilding exports by hand. Start with the accounts you already run at FoPost.