Tracking more metrics doesn't make a report more useful. Neither does ranking networks by engagement rate. Both habits are common advice, and both can point a small team toward the wrong decision.
A useful KPI social media setup starts smaller. Track a short set of metrics, state how each one is calculated, and tie each number to one decision. The denominator matters as much as the headline rate, especially when several accounts and networks sit in one dashboard.
Core Social Media KPIs and How to Calculate Them
A team needs about eight core KPIs. Each one answers a different question, so none of them can replace the rest.
| Metric | What It Measures | Calculation | Best Used For |
|---|---|---|---|
| Reach | Unique people or accounts that saw content | Counted once per person | Measuring unique exposure |
| Impressions | Total times content appeared on screen | Counted every view, including repeats | Measuring total delivery |
| Engagement rate | Interactions relative to a chosen base | Interactions divided by followers, reach or impressions (state which) | Comparing content quality within one account |
| Click-through rate | Share of impressions that produced a click | Clicks divided by impressions | Judging calls to action and link posts |
| Saves | People who bookmarked a post | Count of saves per post | Rating educational and evergreen content |
| Shares | People who passed content on | Count of shares per post | Measuring spread beyond existing followers |
| Follower growth | Net change in followers over a period | Followers at end minus followers at start | Tracking audience building |
| Video watch time | Average viewing duration per video | Total watch time divided by views | Checking whether the opening holds attention |
Reach and impressions are not interchangeable
The Meta definition of reach and impressions defines reach as the number of people or accounts that saw content at least once, while impressions count the total number of times content appeared on screen. If the same ad appears twice to one person, it contributes one to reach and two to impressions. Reach measures unique exposure. Impressions measure total delivery.
Engagement rate has no single standard formula. A team might divide interactions by followers, reach, or impressions, and each choice produces a different number. Write the denominator next to every engagement figure before comparing posts, accounts, or networks.
For click-through rate, divide clicks by impressions. For example, 40 clicks from 2,000 impressions gives a 2% CTR. That calculation is simple, but it only stays comparable when the format, network, and link destination stay similar.
Stronger signals than likes
Saves and shares usually carry more intent than likes. A save means someone expects to return to the content. A share means someone thought it was worth passing to another person. For video, average watch time shows whether the opening holds attention long enough for the message to land.
Teams that also handle replies and service questions can compare these content measures with customer engagement channels and KPIs from Exerta, which is useful context when response speed sits beside publishing results. Copy the table into the reporting document, then add the denominator beside every engagement number. That single habit prevents many false comparisons.
Choosing KPIs That Match Your Goal
Use one primary KPI per goal, plus two supporting metrics that explain why the primary moved. More than that usually creates debate without improving the decision.
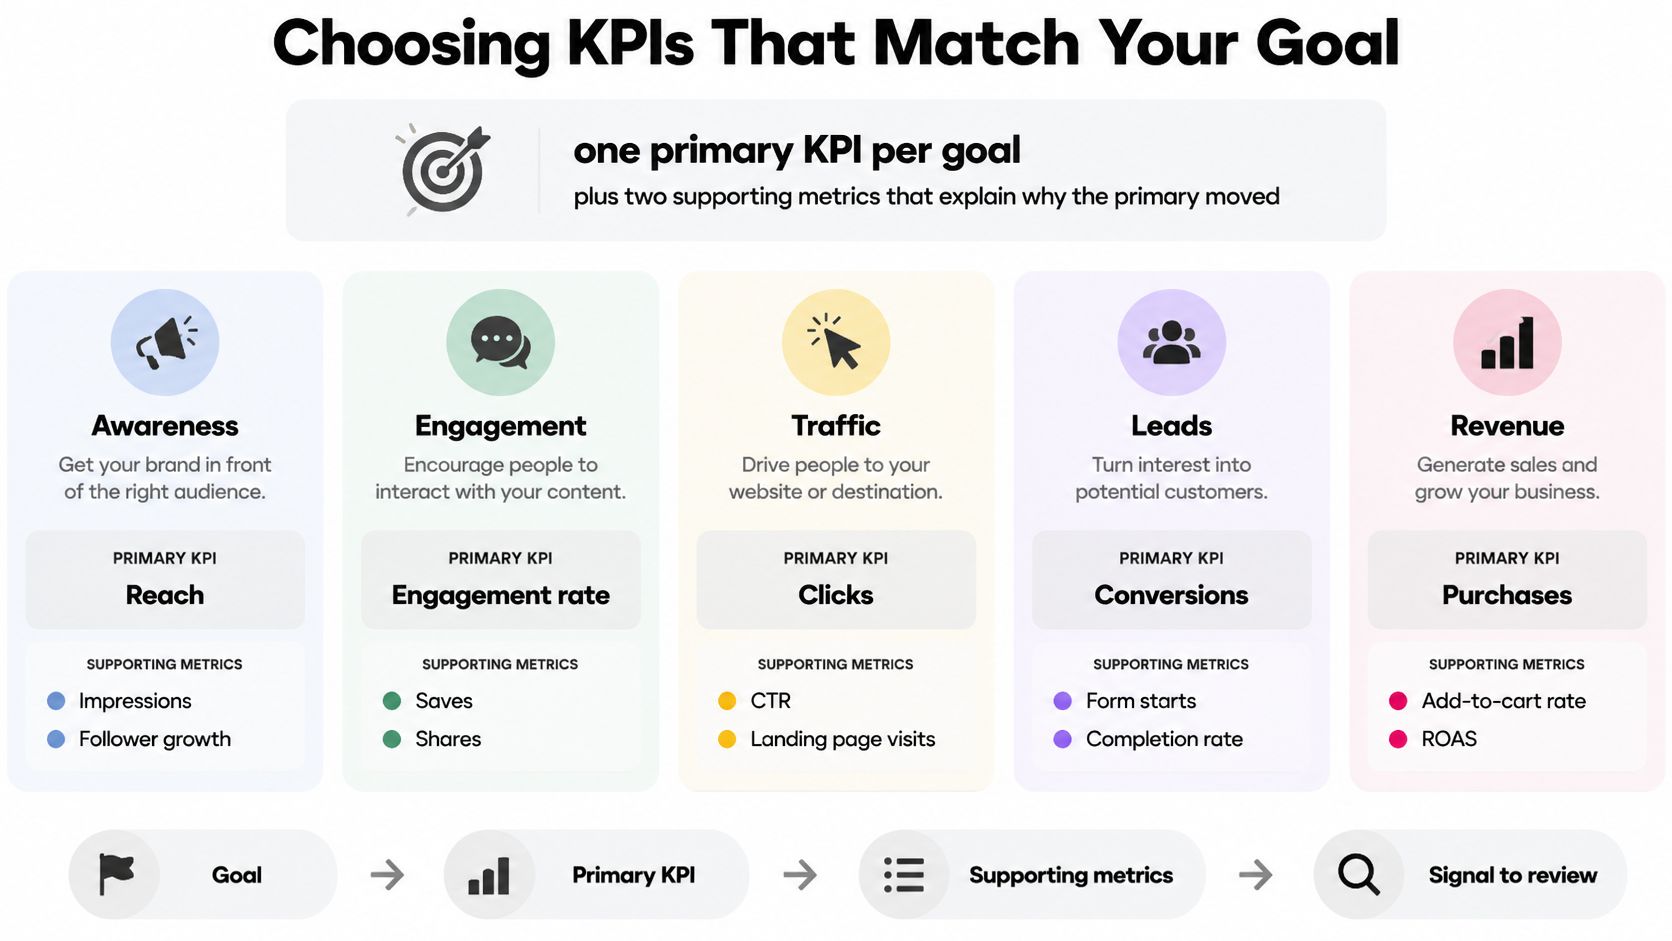
| Goal | Primary KPI | Supporting KPIs | Signal to Watch |
|---|---|---|---|
| Awareness | Reach | Impressions, follower growth | Reach rising at a steady posting rate |
| Community | Saves and shares per post | Replies, comments, qualified mentions | Share of replies that are substantive |
| Traffic | Click-through rate on link posts | Link clicks, UTM-tagged sessions | CTR holding steady as reach grows |
| Leads or sales | Tagged conversions per 1,000 impressions | Assisted sessions, post-purchase survey answers | Conversions rising while CTR holds |
| Retention | Net follower growth | Watch time, repeat viewers | Net growth staying positive for four weeks |
Set the KPI set in five steps
- Write the goal in one sentence: Include a time frame, such as grow LinkedIn traffic by the end of the quarter. A vague goal produces a vague KPI.
- Pick one primary KPI: Choose a metric the team can influence through its own actions, not only through paid spend or platform changes.
- Record a baseline: Use the last 90 days for each network. A target without a baseline can't show progress.
- Choose two supporting metrics: For a community goal, saves and replies explain whether engagement has depth or only volume.
- Match the review window to posting frequency: Review weekly when posting daily. Review monthly when posting once or twice a week, because a weekly sample is too small.
Say a team wants more traffic from LinkedIn. CTR on link posts becomes the primary KPI. Link clicks show volume, and UTM-tagged sessions check whether those clicks arrive on the site. If CTR rises but tagged sessions don't, the problem may sit in tagging, page load, or the destination rather than the post.
Practical rule: A good KPI moves when the action it measures changes. If better hooks, stronger offers, or a new format wouldn't move the number, it's context, not a KPI.
Keep the set stable for a full review cycle. Changing definitions mid-quarter makes the baseline useless and turns every meeting into an argument about math.
Engagement Rate Denominators and Why They Mislead
A high engagement rate can be an arithmetic artifact. Put the same interactions over followers, reach, or impressions and the ranking changes before the content does.
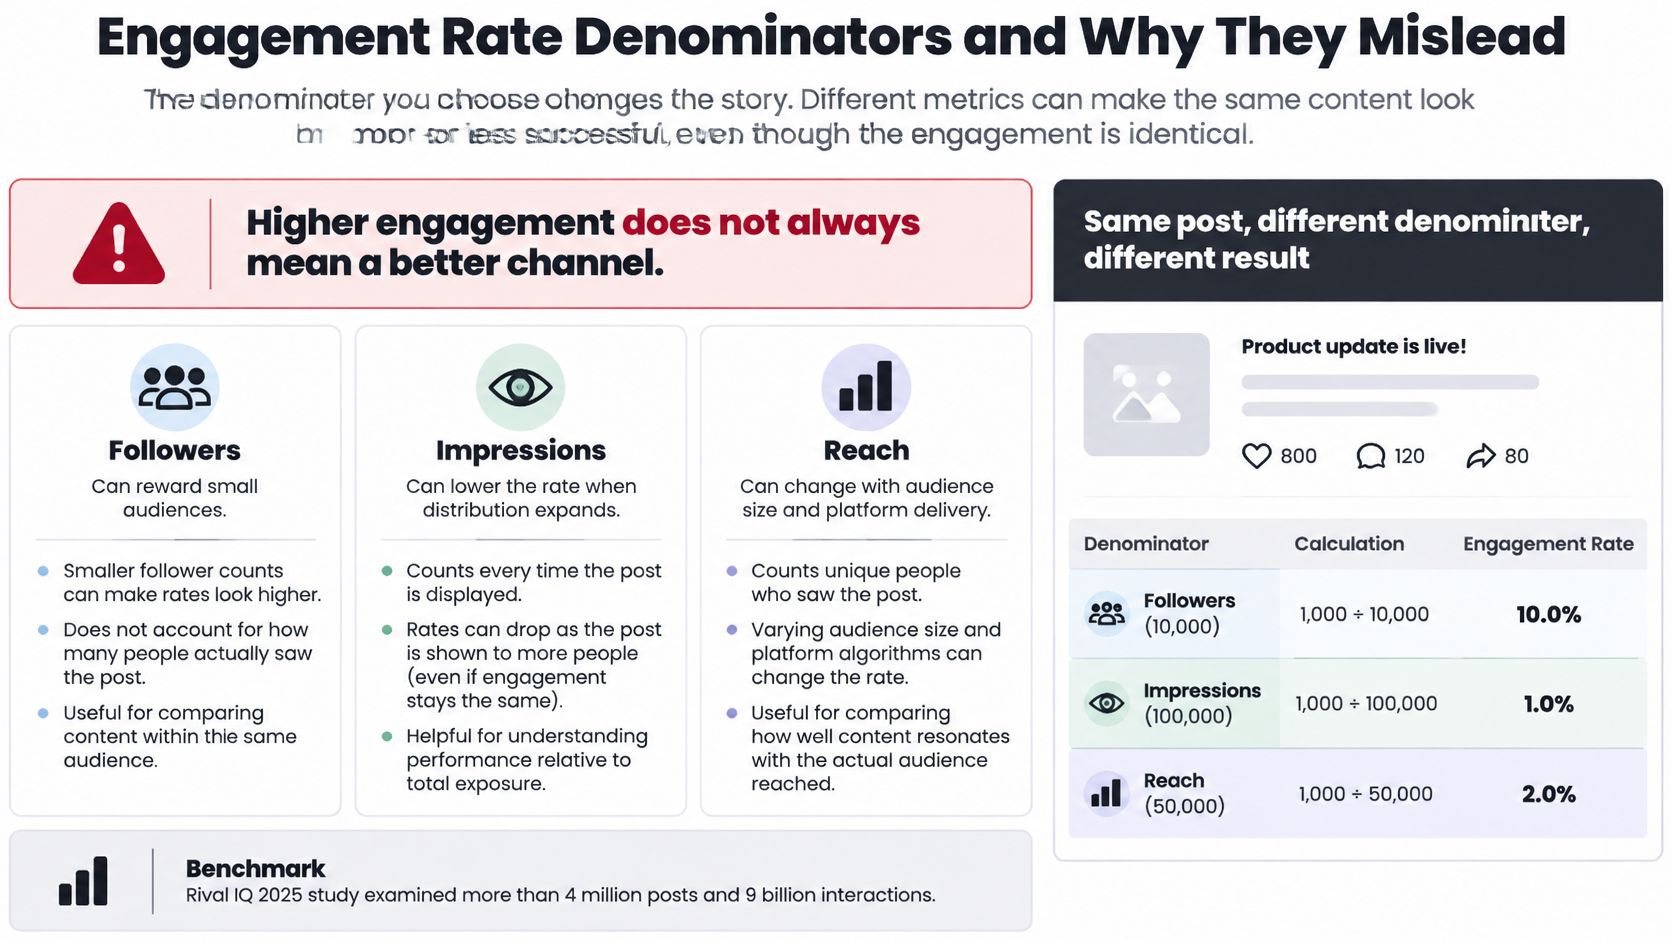
The Rival IQ 2025 Social Media Industry Benchmark Report examined more than 4 million posts and 9 billion interactions across Facebook, Instagram, TikTok, and X, and its engagement-rate definition uses total follower count as the denominator. Benchmarks are useful inside one definition. They become weak evidence for cross-network rankings when each network distributes posts to followers, non-followers, and repeat viewers in different proportions.
One post, three engagement rates
The table below is an illustration using one hypothetical post with 300 interactions, 10,000 followers, 4,000 reach, and 6,000 impressions.
| Denominator | Formula |
|---|---|
| Followers | Interactions divided by followers: 300 / 10,000 = 3.0% |
| Reach | Interactions divided by reach: 300 / 4,000 = 7.5% |
| Impressions | Interactions divided by impressions: 300 / 6,000 = 5.0% |
The audience did not grow or shrink between rows. Only the base changed, yet the reported rate more than doubled between the follower and reach calculations. That spread is why a copied benchmark can make a healthy account look quiet, or make a small reach spike look like proof of resonance.
Use the denominator that matches the question
- Follower-based rate: Use it to judge audience health over time within one account. It can understate a post that traveled well beyond followers.
- Reach-based rate: Use it to judge content resonance among people who saw the post. Treat very small reach samples cautiously because a handful of interactions can move the percentage fast.
- Impression-based rate: Use it to judge response against total delivery, including repeat views. When impressions exceed reach, this denominator is usually the larger one.
Report the median, not the average, for a set of posts. One viral post can lift an average and hide weak typical performance. The median shows the middle result, which is closer to what the next post is likely to do.
Comment quality also needs a separate check. A post can collect many short reactions and still create little trust, which is why using comments as sentiment signals belongs beside raw interaction counts. For the formula choices in more detail, the guide to social media engagement rate covers the calculation options.
Label each engagement number with its denominator before ranking networks or accounts. Without that label, the dashboard is ranking definitions, not performance.
Reading Reach, Impressions and CTR Together
Single metrics rarely tell a team what to fix. Read together, reach, impressions, and CTR separate distribution problems from creative problems.
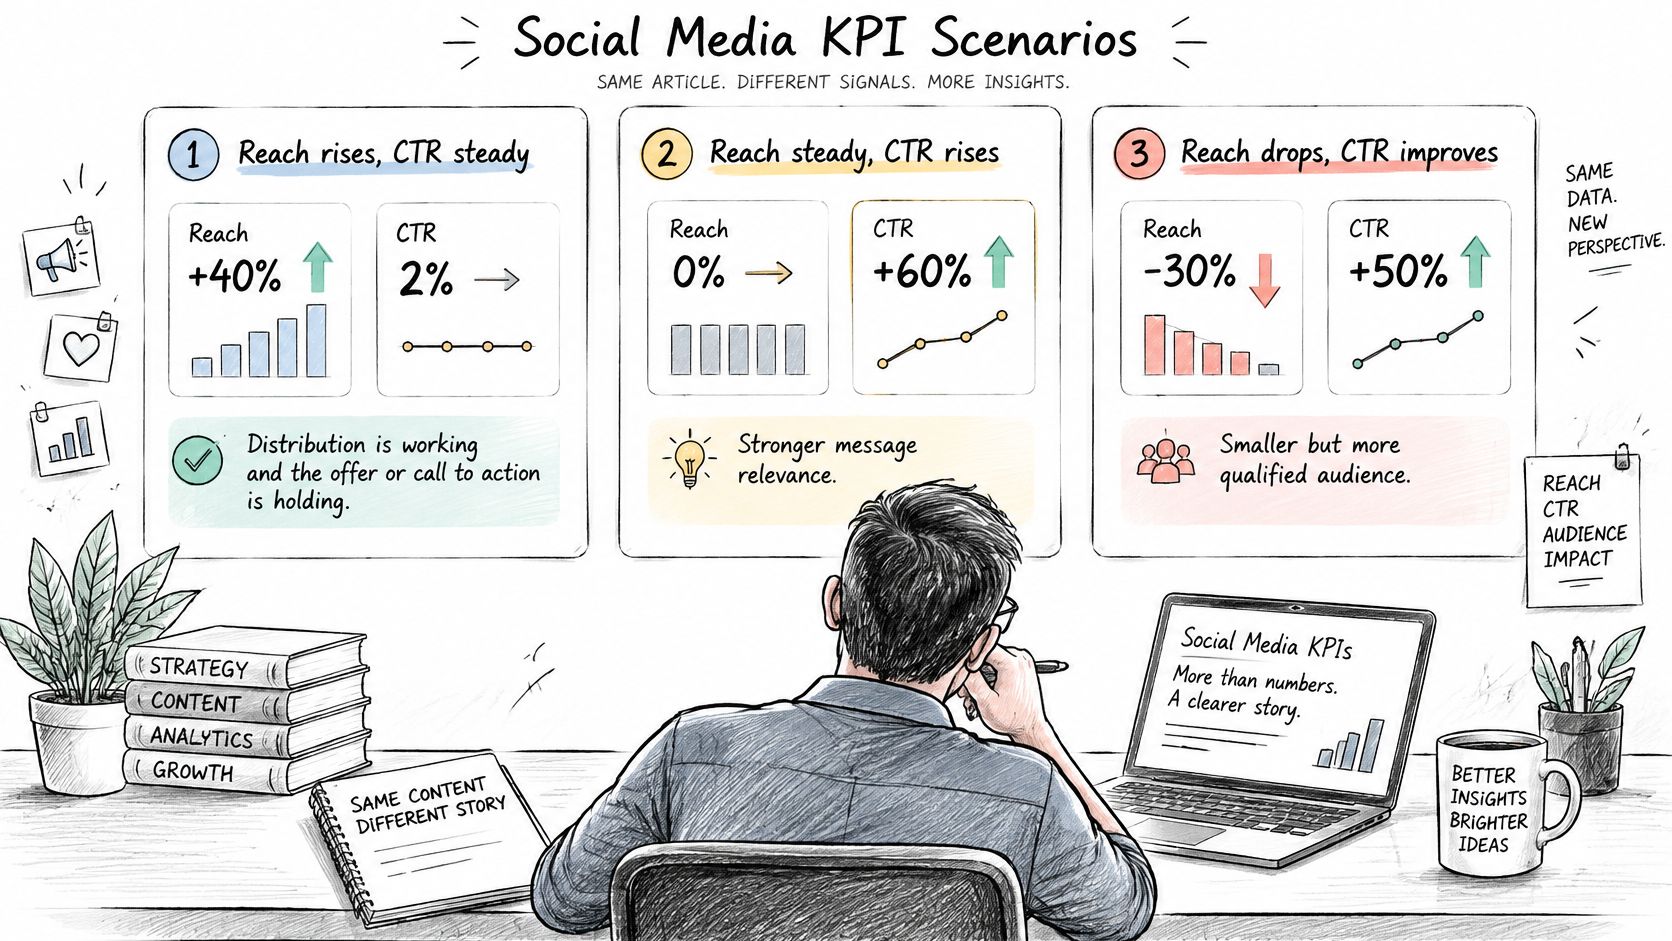
Three scenarios and the action each one supports
Scenario one: reach rises 40% while CTR stays at 2%. Distribution is working and the offer or call to action is holding. Keep the format and destination stable, then test one variable at a time. Changing the hook, image, and landing page together would destroy the comparison.
Scenario two: reach stays flat while CTR drops from 2% to 0.8%. The creative or link is weakening. Change the hook, image, or destination before posting more of the same. More volume won't repair a post that people see but don't act on.
Scenario three: impressions rise faster than reach. The same people are seeing the content repeatedly. That pattern can come from a narrow audience or retargeting rather than growth. Check frequency and audience overlap before calling it momentum.
The Meta explanation of click-through rate states that CTR measures the relationship between response and total delivery, not the percentage of unique people who acted, because impressions can include repeated views by the same people. Keep CTR separate from reach-based metrics when evaluating creative or calls to action.
The short video below walks through how these patterns look when several posts are compared side by side.
Comparison checklist
- Same format: Compare link posts with link posts, not with video or carousels.
- Same network: Keep platform behavior out of the comparison.
- Same time window: Use equal periods so posting volume doesn't distort the result.
- Same link destination: A pricing page and a blog post shouldn't share one CTR target.
Change the creative after two weeks of falling CTR at stable reach. Don't judge a single post, because one weak result can reflect timing, topic, or audience mood rather than a failing format.
Connecting Social Metrics to Business Results
A post with few tracked clicks can still influence demand. A post with many clicks may reach people who were already close to buying. Treating tracked clicks as proof of cause is the mistake.
The social media analytics guide from LoudScale notes that UTMs and analytics platforms don't fully resolve dark social, view-through influence, cross-device behavior, privacy restrictions, or the fact that people may encounter content on one platform and convert elsewhere. A stronger framework pairs operational metrics with causal methods such as holdout tests, geo experiments, post-purchase surveys, and marketing-mix modeling.
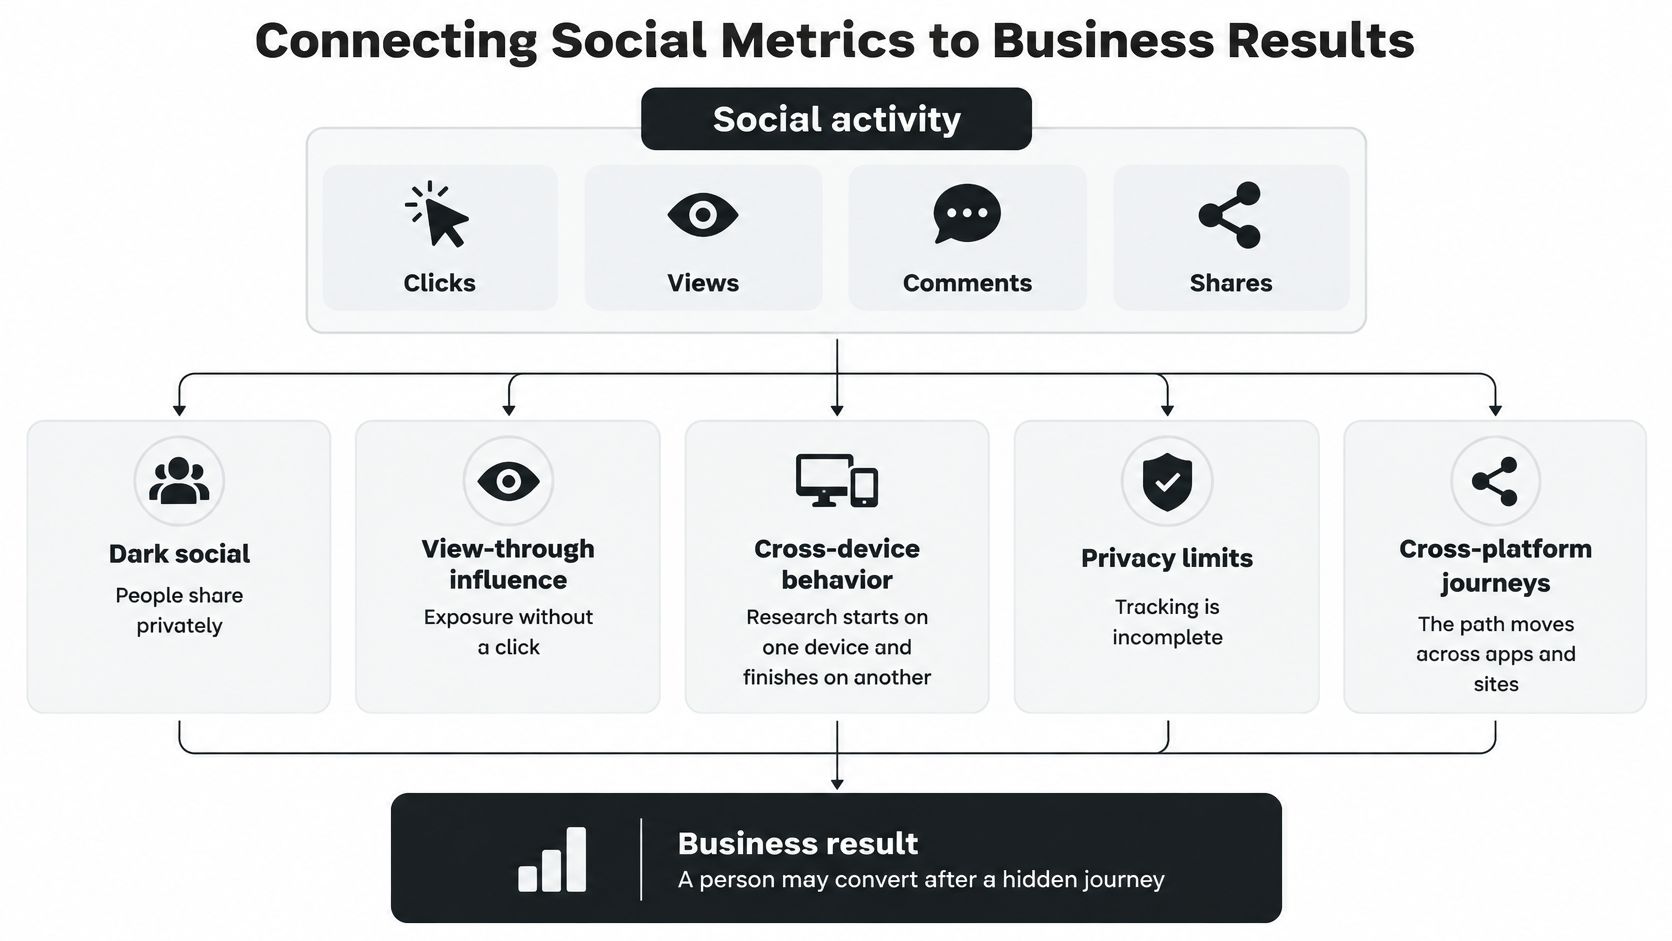
Dark social covers private sharing in messages, email, and group chats. View-through influence happens when someone sees a post, doesn't click, and later searches for the brand. Cross-device behavior breaks the trail when research starts on a phone and ends on a laptop. Privacy limits and consent controls remove still more of the path.
A three-rung measurement ladder
Rung one: platform KPIs for weekly optimization. Reach, watch time, saves, shares, replies, and follower growth show whether content earns attention. Use them to adjust topics, hooks, and formats. Don't use them to claim revenue impact.
Rung two: tagged sessions for directional conversion analysis. UTM-tagged sessions and conversions show which channels send identifiable traffic and buyers. The data is useful, but it's incomplete. Treat it as a direction signal, not a full account of influence. Teams that also run paid placements can use connecting paid attention to real revenue from FindClout as context for separating paid response from business outcome.
Rung three: incrementality tests for budget and strategy decisions. Holdout groups, geo experiments, and post-purchase surveys estimate what changed because publishing occurred. For example, a brand can pause posting in one region for four weeks and compare sales with a matched region where posting continues. A checkout survey can ask how the buyer first heard about the brand, which often surfaces social influence that click tracking missed.
The practical guidance on how to track social media analytics fits rung one and rung two, where consistent collection matters most. Rung three needs a test design, not another dashboard.
Stop optimizing reported attribution and start testing lift when the decision involves significant budget, or when clicks and sales disagree for two months.
That rule keeps small teams from overbuilding measurement. Weekly content choices don't need a geo experiment. A decision to cut a network, shift budget, or hire another creator does.
Reporting Routine and Your Next Step
Consistent structure comes before better charts. Give every account and campaign a consistent name and label, keep each brand or client in its own workspace, and build roll-ups only after each account has been reviewed on its own. A combined view that skips the account-level check hides the source of almost every change.
| Cadence | Metrics to Review | Decision It Supports |
|---|---|---|
| Daily | Scheduled versus published posts, failed posts, inbox response time | Fix failed posts and urgent replies |
| Weekly | Reach, CTR, saves per post, for each account | Adjust format, hook and posting times |
| Monthly | Follower growth, median engagement by network, conversions by campaign label | Shift topics, formats or budget |
| Quarterly | Goal KPIs against baseline, results of incrementality tests | Reset goals and targets |
Daily checks are operational, not strategic. A failed post or an unanswered complaint needs action the same day. Weekly reviews handle content adjustments, because a team posting often has enough new posts to compare formats and hooks without reacting to one result.
Monthly reviews are where budget and format shifts belong. Quarterly reviews test whether the goal itself still fits the business. Mixing those decisions into a daily dashboard creates churn, because every small dip starts to look like a strategy problem.
Run the monthly review in four steps
- Export per-account metrics for the same date range: Unequal ranges make growth look better or worse than it is.
- Check every denominator against the definition on file: Confirm whether engagement used followers, reach, or impressions for each network.
- Flag posts above twice the account median: Note what changed in topic, format, hook, timing, or distribution. Don't copy the post blindly until the reason is plausible and repeatable.
- Write one decision line per account: An example is shift two posts a week from carousels to short video. A report without a decision line is an archive, not a management tool.
Say an agency manages twelve client accounts and sees a follower spike in the combined view. Campaign labels show the spike came from one client's launch. Without labels, the agency might credit a content change across all twelve accounts and repeat the wrong tactic for the other eleven.
Labels also protect client reporting. A launch, a giveaway, and routine educational posts shouldn't share one performance average. Separate labels let the agency show what each type of work produced and keep one unusual campaign from setting expectations for the next quarter.
For layout and stakeholder format, the guide to building a social media report gives a practical structure to adapt. Keep the decision line at the top of each account summary, then place supporting metrics below it. Executives and clients read outcomes first. Post-level detail belongs after the decision, not before it.
FoPost analytics include impressions, reach, engagement, clicks, likes, comments, shares, saves, and follower counts, where the network provides them. Each workspace has analytics showing reach, engagement, and follower change for every account in it. Posts can be grouped by campaign or client label to compare their results. That structure helps a team running several networks keep definitions and denominators consistent while still reviewing each account separately.
Share the KPI sheet with the people who write the posts. Writers who can't see saves, watch time, or CTR by format will keep guessing, and reviewers will keep judging drafts by taste.
Start today with one account. Open the last 90 days of post data, calculate the median engagement rate with one stated denominator, and record it as the baseline. Change nothing else until that baseline exists.
FoPost lets small teams schedule and publish to every major network from one place, with workspace analytics and campaign labels that keep KPI social media reporting consistent across accounts. Developers can use the API and SDKs to build the same publishing and measurement workflows into their own tools, and AI assistance helps adapt each post for its network. Visit FoPost to set up a workspace and calculate the first baseline from connected accounts.