Three networks, one small team, and a blank content calendar on Monday morning. Someone fills the empty cells with posts that feel useful, the team ships eleven of them by Thursday, and nobody can say which one moved a number that finance cares about.
That's the problem this guide solves, and it doesn't get solved by posting more. A social media strategy is a chain: one business goal at the start, one measured result at the end, and every post placed somewhere in between. Build the chain and the daily posting decisions get easier. Skip it and you're paying people to keep a feed warm.
Table of Contents
- The Five Parts of a Social Media Strategy
- Start With Business Goals and the Metrics That Prove Them
- Pick Audiences and Platforms by Fit, Not Habit
- Adapt One Campaign Across Platforms
- Set Posting Frequency and Plan Around Platform Limits
- Measure Incremental Impact, Not Just Engagement
- Write Your Strategy on One Page This Week
The Five Parts of a Social Media Strategy
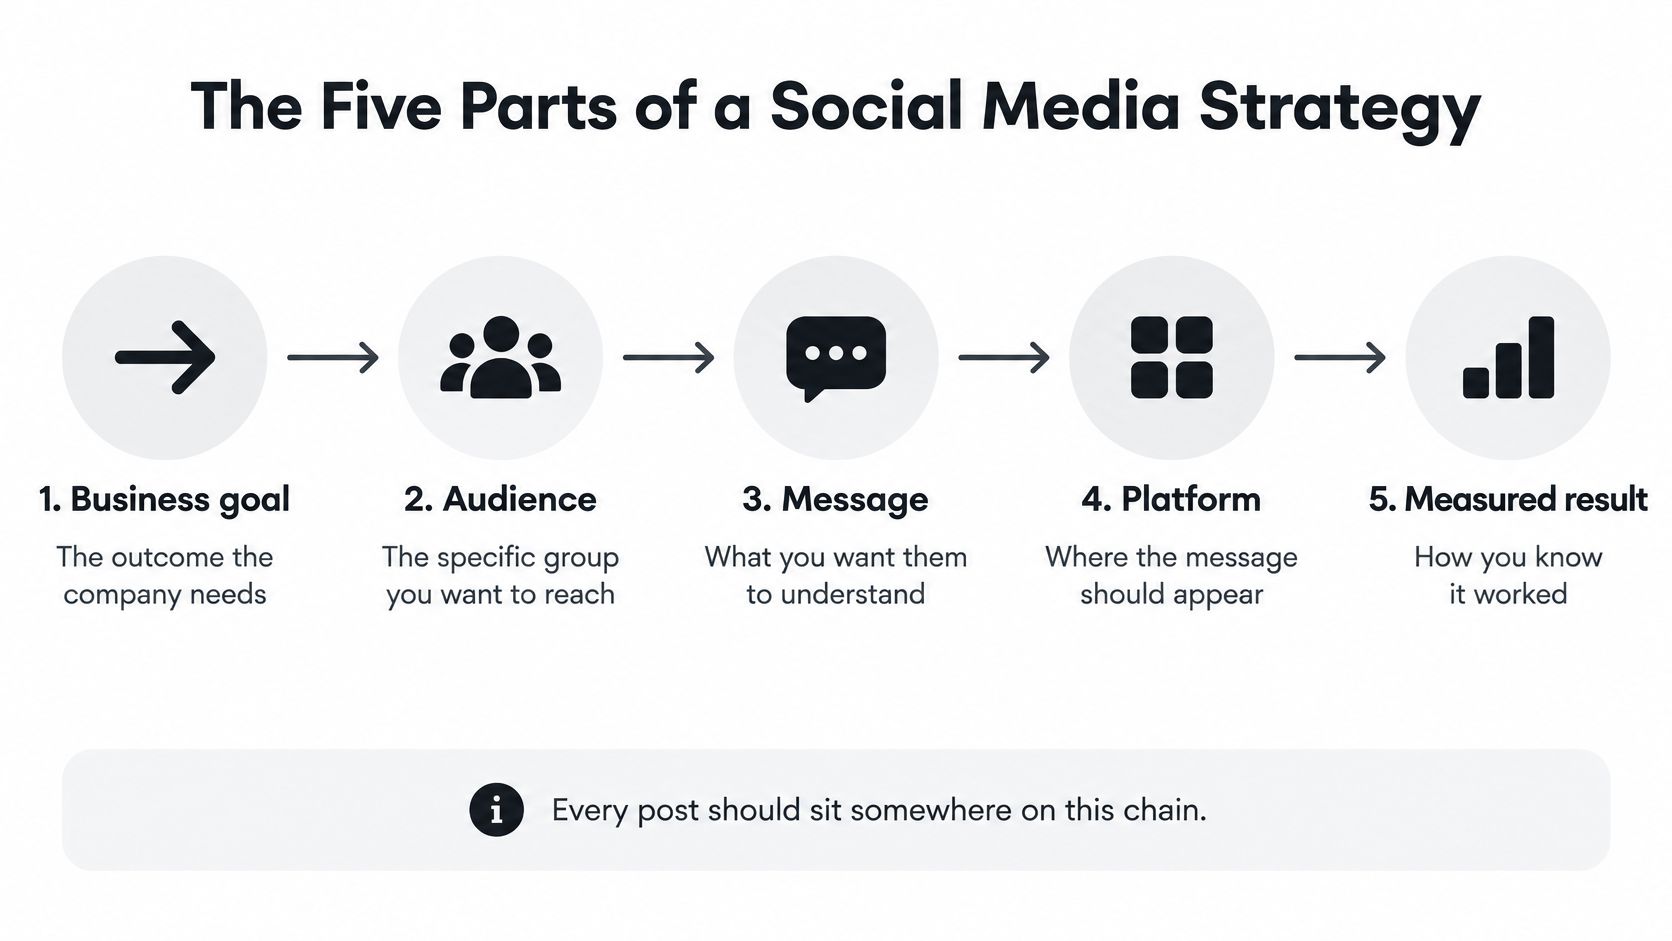
Start with the answer. A social media strategy has five parts, in order: business goals, audiences, channels, content and cadence, measurement. Each part answers a question and produces something a team can use.
| Part | Question it answers | Output | Example |
|---|---|---|---|
| Business goals | What must change for the business? | One measurable goal per network | Grow email subscribers by 500 in 90 days |
| Audiences | Who must we reach and why? | Two or three named segments | Software buyers aged 30 to 49 who manage teams |
| Channels | Where do those segments spend time? | Two or three networks with a stated role | LinkedIn for buyers, YouTube for demos |
| Content and cadence | What do we publish, how often and in what form? | Pillars, formats and a weekly baseline | Three pillars, four posts a week per network |
| Measurement | How will we know it worked? | Metrics tied to the goal, plus a baseline | Trial sign-ups compared with a holdout group |
Here's the same chain as a single line, from goal to measured result.
The scale behind this framework is hard to argue with. The DataReportal Digital 2025 global overview counts 5.24 billion active social media user identities worldwide, a 4.1% rise over twelve months, and reports that 97.3% of connected adults use at least one social network or messaging platform each month.
The same report sets the typical internet user at 2 hours 21 minutes a day on social media, which is 10 minutes lower than two years earlier, across an average of 6.83 platforms per month.
Three planning consequences follow.
- Audiences are too broad to treat as one group. Nearly every connected adult is reachable, which means reach alone tells you nothing about whether you found the right people.
- Attention is split across networks. A person who sees your LinkedIn post may never see the same idea on YouTube, so one calendar entry isn't one impression.
- Time is finite and slightly shrinking. Daily use fell by 10 minutes in two years, so winning a bigger share of a fixed budget takes relevance, not volume.
For a wider treatment of how goals, content and community fit together, Silver Spoon Agency's social media guide works as a companion read.
Test this week: take one post from last week and name the part of the chain it serves. Which goal, which audience, which channel role, which metric. If it serves none of them, it was activity, not strategy.
Start With Business Goals and the Metrics That Prove Them
The mismatch shows up in almost every first draft of a plan. The stated goal is more trial sign-ups, and the metric the team watches daily is follower count. Those two things are connected by hope, not by logic.
The rule that fixes it: a goal names a business result, and a social metric earns its place only if it moves toward that result. If the number can climb while the business result stays flat, it's a vanity metric for your purposes.
| Business goal | Social metric to watch | Business metric | Illustrative target |
|---|---|---|---|
| Sell more software trials | Link clicks and landing page sessions | Trial sign-ups | 150 trial sign-ups in one quarter |
| Grow an email list | Profile visits and link clicks | Email subscribers | 500 new subscribers in 90 days |
| Support existing customers | Mentions and messages answered | Support tickets resolved in channel | Reply to 90% of mentions within 4 hours |
| Build brand demand | Reach and video views | Branded search volume | 10% rise in branded searches over one quarter |
| Recruit candidates | Video views and saves | Qualified applications | 30 qualified applications in one quarter |
Those targets are illustrative. Set yours from your own baseline, because a target copied from someone else's account is a guess wearing a suit.
A five-step method for setting each goal
- Write the business goal in one sentence. "We need 150 more trial sign-ups this quarter" beats "grow our presence."
- Pick the one social metric closest to the action. For trials, that's link clicks and landing page sessions, not impressions.
- Pick the business metric your sales or finance team already tracks. If it appears in their dashboard, the goal survives scrutiny.
- Set a target and a review date. Put both in the same line so nobody can move the goalposts.
- Cap each network at two or three goals per quarter. A small team with eight goals per network has no goals.
Practical rule: if you can't name the person outside marketing who looks at the business metric, the goal isn't tied to the business yet.
The sentence template to copy
Use this structure and fill in the blanks: On [named network], we will move [named social metric] from [baseline] to [target] by [date], to support [named business metric].
An example: on LinkedIn, we will move link clicks from 400 to 900 per month by March 31, to support 150 trial sign-ups this quarter. That sentence does three jobs. It commits to a channel, it puts the activity next to the outcome, and it gives the team something to argue about with evidence at the review meeting rather than with opinion.
The failure mode to watch for is a goal nobody can fail. "Increase engagement" can't be missed, so it teaches nothing. A target with a baseline and a date can be missed, which is exactly why it drives decisions.
Pick Audiences and Platforms by Fit, Not Habit
Teams often choose networks like people choose restaurants: the one they are already familiar with. The Pew Research Center survey of 5,733 U.S. adults, conducted from May 19 through September 5, 2023, explains why this habit limits your reach: 83% of adults reported ever using YouTube, 68% Facebook, and 47% Instagram.
The totals are the easy part. The demographics decide the plan. Adults aged 30 to 49 were the most likely LinkedIn users at 40%, compared with roughly three in ten among adults 18 to 29 and 50 to 64, and only 12% of adults 65 and older.
So Facebook and YouTube buy you breadth, while Instagram and LinkedIn buy you a specific group of people with a specific frame of mind. They're not interchangeable, and follower count doesn't tell you which one you're buying. The same message lands with different humans on each network.
Platform roles also differ by behavior, not just by demographics. Meltwater's summary of the Digital 2025 data reports that Instagram was the leading channel for brand research, with 62.3% of active adult users using it to investigate brands and products, while YouTube was the most-used platform globally. That's a discovery-versus-trust split you can plan around.
A selection method that survives a small team
- Define one or two segments properly. Each gets a job title or life situation, an age range and a problem worth solving. "SMB owners who handle their own hiring" is a segment. "Everyone" isn't.
- Check where those segments already spend time. Use the platform's own audience data plus your existing followers. If 70% of your followers are on one network, that's a signal about who you already attract.
- Pick no more than three networks and write the role of each. Discovery, trust, or conversion. A network with no stated role will absorb hours and return nothing.
- Drop what doesn't fit, even if competitors live there. Their audience isn't yours, and their team size probably isn't either.
Two networks run well beat five run badly. For a deeper look at how this plays out in professional selling, this breakdown of social media for B2B covers the segment-first approach in more detail.
Adapt One Campaign Across Platforms
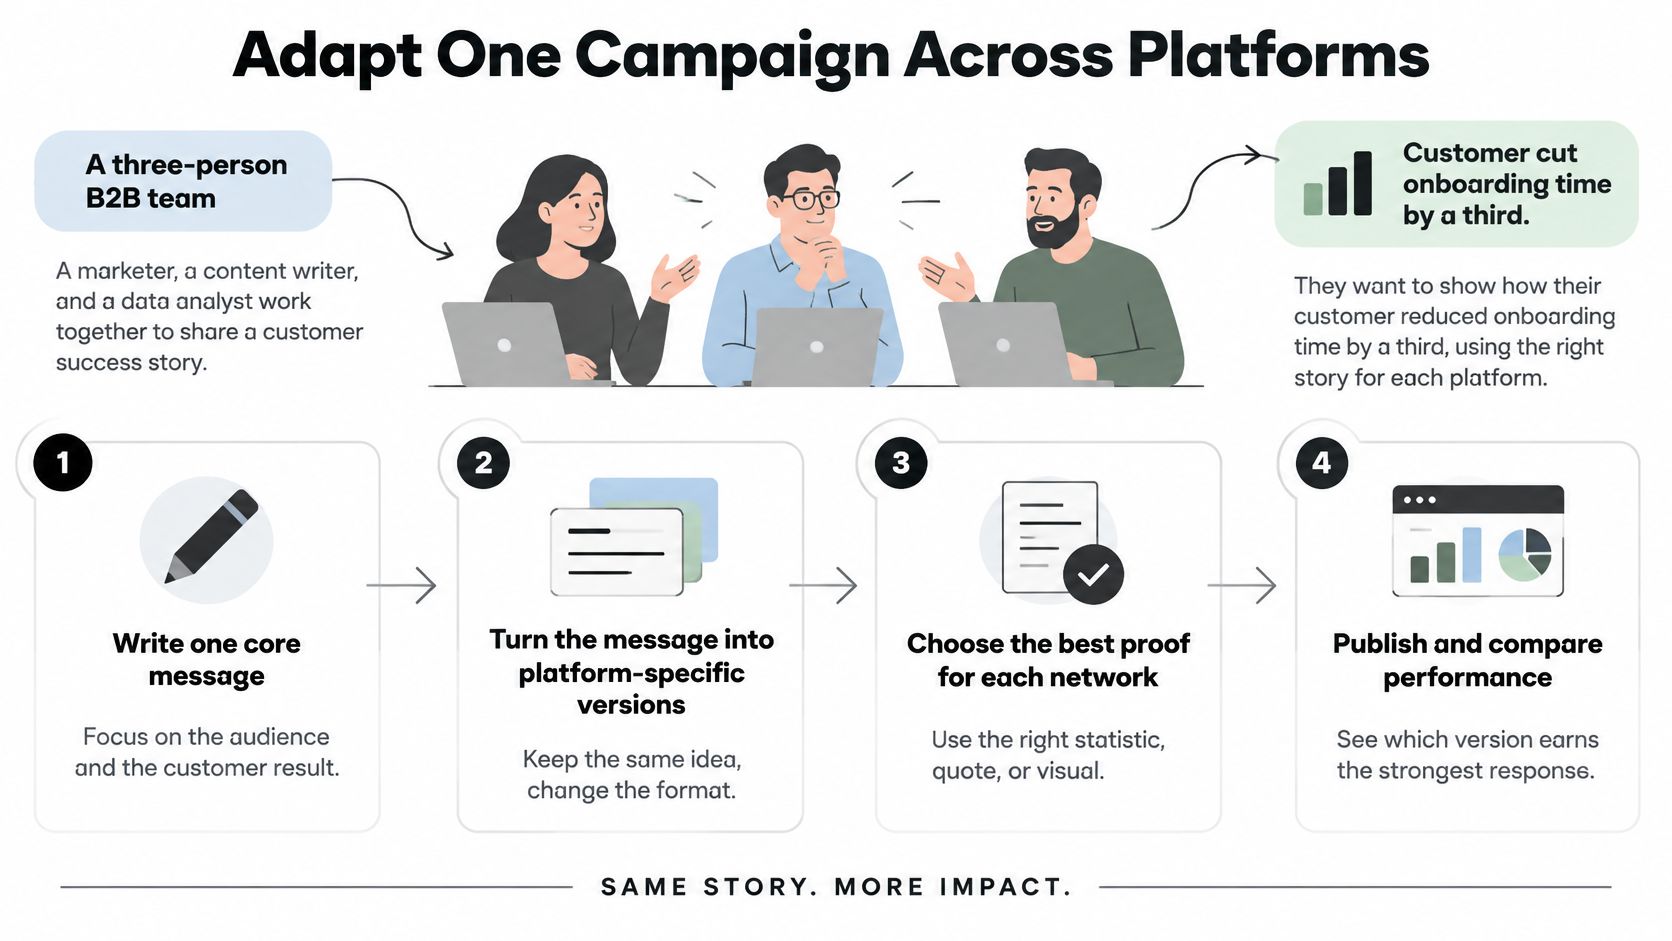
Say a three-person B2B team has a customer story worth telling: the customer cut onboarding time by a third after switching. One idea, four networks, four different shapes. Here's the workflow.
- Write one core message with three parts. The audience (operations leads at mid-sized firms), the claim (onboarding dropped by a third) and the proof (the customer's own numbers and a quote from their ops manager). Nothing platform-specific yet.
- Assign the message to a content pillar. Three to five pillars is enough: customer results, product how-tos, team process. This one is customer results, which means it traces back to the trial sign-up goal.
- Adapt the shape for each network. On LinkedIn, a three-sentence opener that leads with the number. On X, a four-post thread with the number, the quote, the method and the link. On Instagram, a 30-second clip of the ops manager saying what changed. On YouTube, an eight-minute walkthrough of the migration.
- Schedule each version and publish into an active window. Same idea, different upload times, because audiences don't wake up together.
- Review first-hour signals before judging the post. Comments, saves and shares in the first 60 minutes tell you about distribution. Week-one totals tell you about accumulation.
Early interaction matters more than many teams assume, because ranking systems decide who sees version two. A preregistered study of Reddit's r/popular feed found that moving a post from the top position to ranks 6 to 10 cut its odds of receiving engagement by about 40%, even though users rarely said rank influenced their choices, as reported in the published analysis on arXiv.
That figure comes from one feed, so treat it as evidence that position shapes engagement, not as a rule for TikTok. The lesson transfers: publish when your audience is awake, and make the opening sentence earn the scroll stop.
The first hour is a distribution test. The first week is a creative test. Don't confuse them.
Report signals that separate creative from distribution
Track normalized engagement rate by impressions, time to first interaction, and the share of reach that came from recommendations versus followers. Those three numbers tell you whether a weak post was badly made or badly placed. A post with strong engagement per impression and almost no reach has a distribution problem, not a creative one.
Platform-aware schedulers make the mechanical part cheaper. FoPost publishes adapted versions of a post to every major network from one workspace, and its AI rewriting drafts platform-specific variants that a person should still review before release. The reviewing isn't optional, because a rewritten hook can change a claim.
When you're coordinating several versions of the same campaign, this guide to posting to all social media at once covers the sequencing and duplication traps.
Set Posting Frequency and Plan Around Platform Limits
Frequency is a variable you test, not an article of faith. Analysis covering 4.8 million channel-week observations, published in Buffer's state of social media engagement report, found that accounts which posted at least once in a week generally beat their own growth baseline in weeks with no posts, and accounts publishing 10 or more times weekly averaged 32 additional followers per week relative to silent weeks.
That's observational data. It doesn't prove that more is always better, because busier accounts may have more resources and better content. Run your own test.
A six-week cadence test
- Set a baseline cadence per network. Four posts a week on LinkedIn, three on Instagram, one long video on YouTube. Whatever you can sustain.
- Alternate higher and lower volume weeks. Six to eight weeks gives you three or four comparisons without changing anything else.
- Compare follower growth, reach per post, engagement per impression and unfollows. Add conversions if you track them.
- Keep a minimum presence during busy weeks. Never let an account go silent to protect a test. Schedule the floor in advance.
Watch the efficiency side too. Doubling output can double total reach while halving attention per post, so report aggregate results next to the incremental gain from each extra post.
Platform limits that change your scheduling plan
| Platform and scope | Limit | What it changes |
|---|---|---|
| Instagram professional account | Up to 50 published posts in any moving 24 hours | Caps the size of a daily batch |
| Instagram staging | Up to 400 media containers in a rolling 24 hours, each expires after 24 hours | Limits bulk preparation |
| Instagram video | MP4 or MOV files | Validate files before upload |
| TikTok unaudited API clients | Up to 5 users posting in 24 hours, accounts must be private | Limits multi-account tools |
| TikTok Direct Post | About 15 posts per creator account per day, shared across API clients | Sets a queue limit per account |
| TikTok status checks | 30 status requests per minute per user access token | Requires capped polling |
The Instagram numbers come from the Instagram content publishing limit reference, which separates published posts from staging containers. Those are two different ceilings, and a bulk workflow usually hits the container limit first.
TikTok splits its constraints differently. The TikTok content sharing guidelines describe the unaudited-client user cap and the per-creator daily posting cap, and note that error codes such as spam_risk_too_many_posts signal that you've crossed one.
Status polling has its own budget. TikTok's Direct Post reference documents the 30-requests-per-minute token limit, HTTP 429 responses and the five-pending-shares ceiling. Use exponential backoff, cap your polling, store each publish ID, and don't create a fresh upload while the original is still processing.
Measure Incremental Impact, Not Just Engagement
Here's the uncomfortable baseline. 40% of marketers say measuring social media ROI is difficult, 56% cite insufficient data and 46% cite fragmented data, according to the Brandwatch Marketer 2025 report. The same report puts brands at only 69% of their social media business objectives achieved. Activity is happening. Results are lagging.
Incrementality is the plain version of the question. Not "did a buyer see a post," but "did the post cause a sale that wouldn't have happened otherwise." A buyer who saw twelve posts and then bought may have been coming anyway.
How to run a holdout without a data team
Pick one outcome before launch. One. Sign-ups, demos, revenue, applications.
Record your baseline first. Last 90 days of that outcome, by market or region.
Hold out a comparable group. Geo holdouts work for local businesses: pause social in two matched cities. Time-based holdouts work for smaller teams: compare a two-week pause against the prior two weeks in the same region.
Join platform data to CRM and web analytics. Match by email, UTM or lead ID. Without the join, you're reporting two separate stories.
Report confidence limits. A 6% lift on 40 conversions is noise. Say so rather than rounding up.
| Measure | What it tells you | How to calculate |
|---|---|---|
| Lift in business outcome | Extra sales or sign-ups caused by social | Exposed conversion rate minus holdout conversion rate, times the exposed group size |
| Cost per incremental outcome | Whether social pays for itself | Program cost divided by incremental outcomes |
| Normalized engagement rate | Creative quality, independent of reach | Engagements divided by impressions |
| Time to first interaction | Early distribution signal | Minutes from publish to first comment, share or save |
| Recommended reach share | How much reach comes from recommendations versus followers | Recommendation impressions divided by total impressions |
| Positive or neutral sentiment share | Whether engagement is favorable | Share of a reviewed sample of comments rated positive or neutral |
Choose the question before the campaign: are you buying attention, qualified action, or influence? Each one needs a different test, and a clicks-only dashboard can't answer the third.
Cross-network publishing complicates this in a specific way. Duplicated reach inflates your exposed group and contaminates the comparison, so log which audiences saw which message and by what route. For the tracking setup itself, this walkthrough of how to track social media analytics covers the joins that make holdout reporting possible.
The last honest step is labeling. When social looks like a last-click channel, it steals credit from brand activity. When it's credited for every conversion, it takes credit it didn't earn. Name it as influence or as action, then defend that choice with the holdout data.
Write Your Strategy on One Page This Week
Start with one sentence, today, before touching a content calendar: on [network], we will move [social metric] from [baseline] to [target] by [date], to support [business metric]. Write it for the network where you already have evidence.
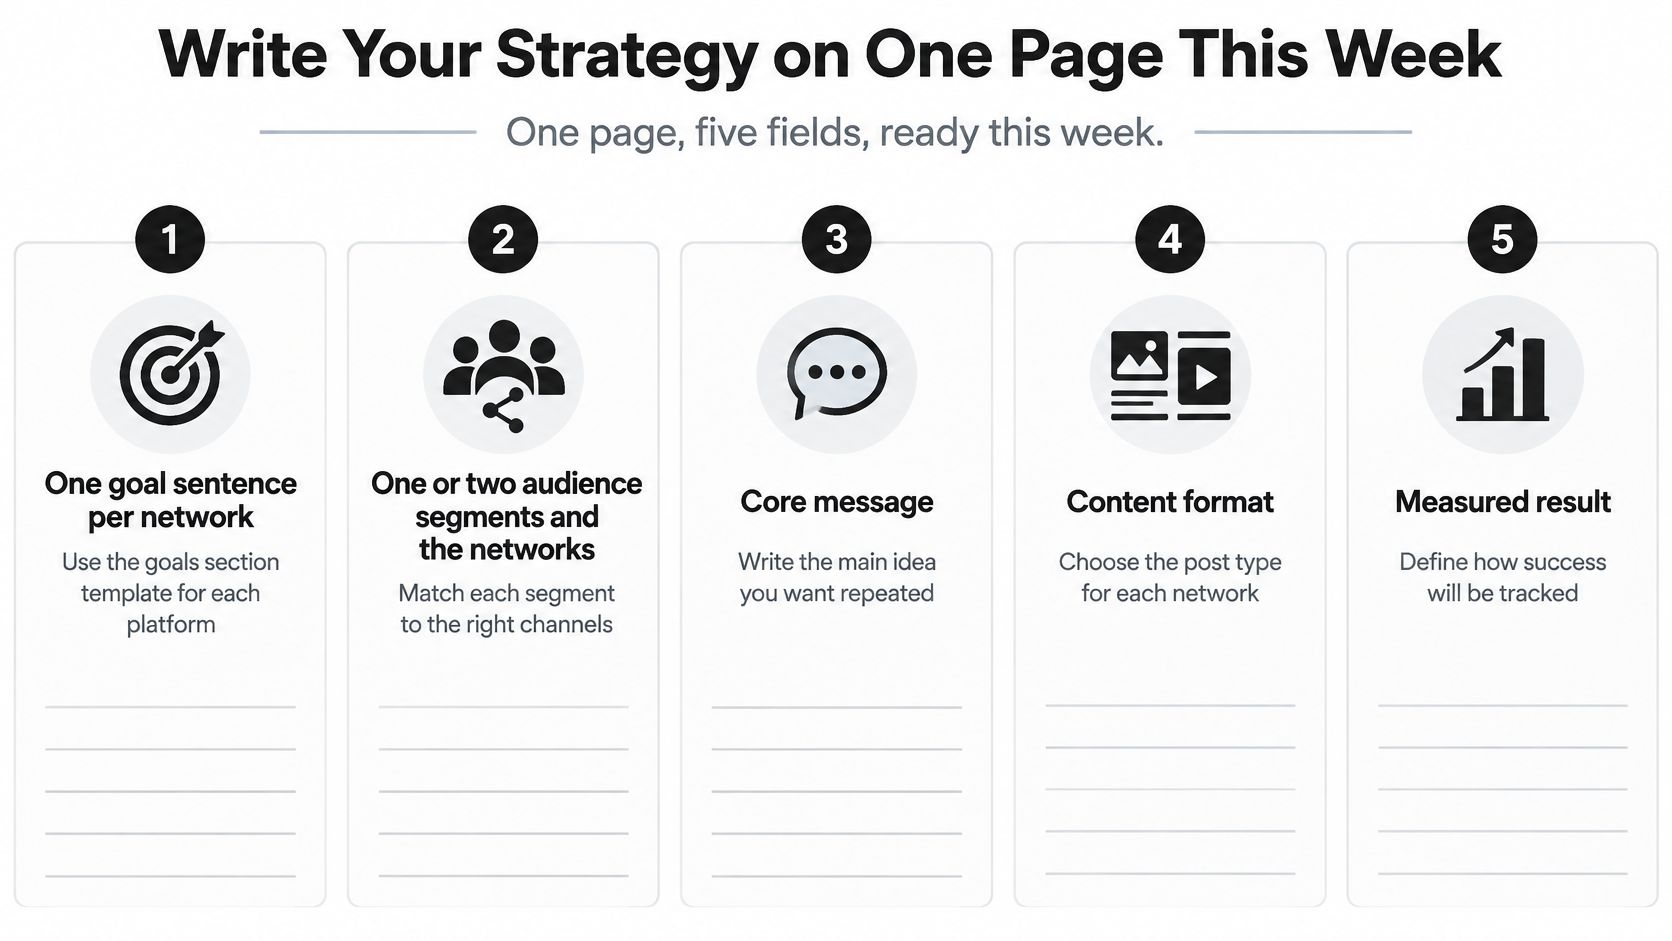
The rest of the strategy fits on a single sheet. Five fields, nothing more.
- One goal sentence per network, using the template above. Two or three networks maximum.
- One or two audience segments, each with a job, an age range and a problem, plus the networks that fit them.
- Core message, written once, with the claim and the proof that supports it.
- Content format and cadence, three to five pillars, the format each network uses for them, and a weekly baseline plus the six-week frequency test.
- Measured result, the outcome metric, the holdout method and how often you report it.
Put a review date 90 days out on the shared calendar now. Not 30 days, because most channels need a few weeks of distribution before the numbers mean anything, and not six months, because a plan nobody revisits becomes a document nobody trusts.
The one-page limit is the point. A strategy that runs to fourteen pages gets read once in January and never again. A single sheet taped next to the publishing schedule gets consulted before every post, which is the only moment it can change a decision.
Software doesn't decide the strategy. The one-page document does. Tools just make execution cheaper once the choices are made.
That's the whole chain: goal, audience, channel role, adapted content, measured result. Each link is a decision you can point at, defend, and revise with data. What makes it work isn't sophistication. It's that every post on the calendar can be traced to the first line of the page.
A strategy built on adapted content across several networks needs a publishing workflow that keeps up with it. FoPost lets a team write a post once, adapt it for each network, schedule it, publish it, and measure the results across 33 networks from a single workspace, with AI rewriting drafts and per-account analytics for reach, engagement and follower change. If you're ready to move from the one-page plan to consistent execution, FoPost is where the calendar, the adaptations and the numbers live together.