
A social media report turns scattered account statistics into decisions about what to publish, change, or stop. Say a founder opens Instagram, LinkedIn, X, and YouTube on Monday morning. Each app shows activity, but none explains which posts deserve another round or which account needs attention. A useful report answers those questions without making the team interpret a pile of screenshots.
What a Social Media Report Is and Who Reads It
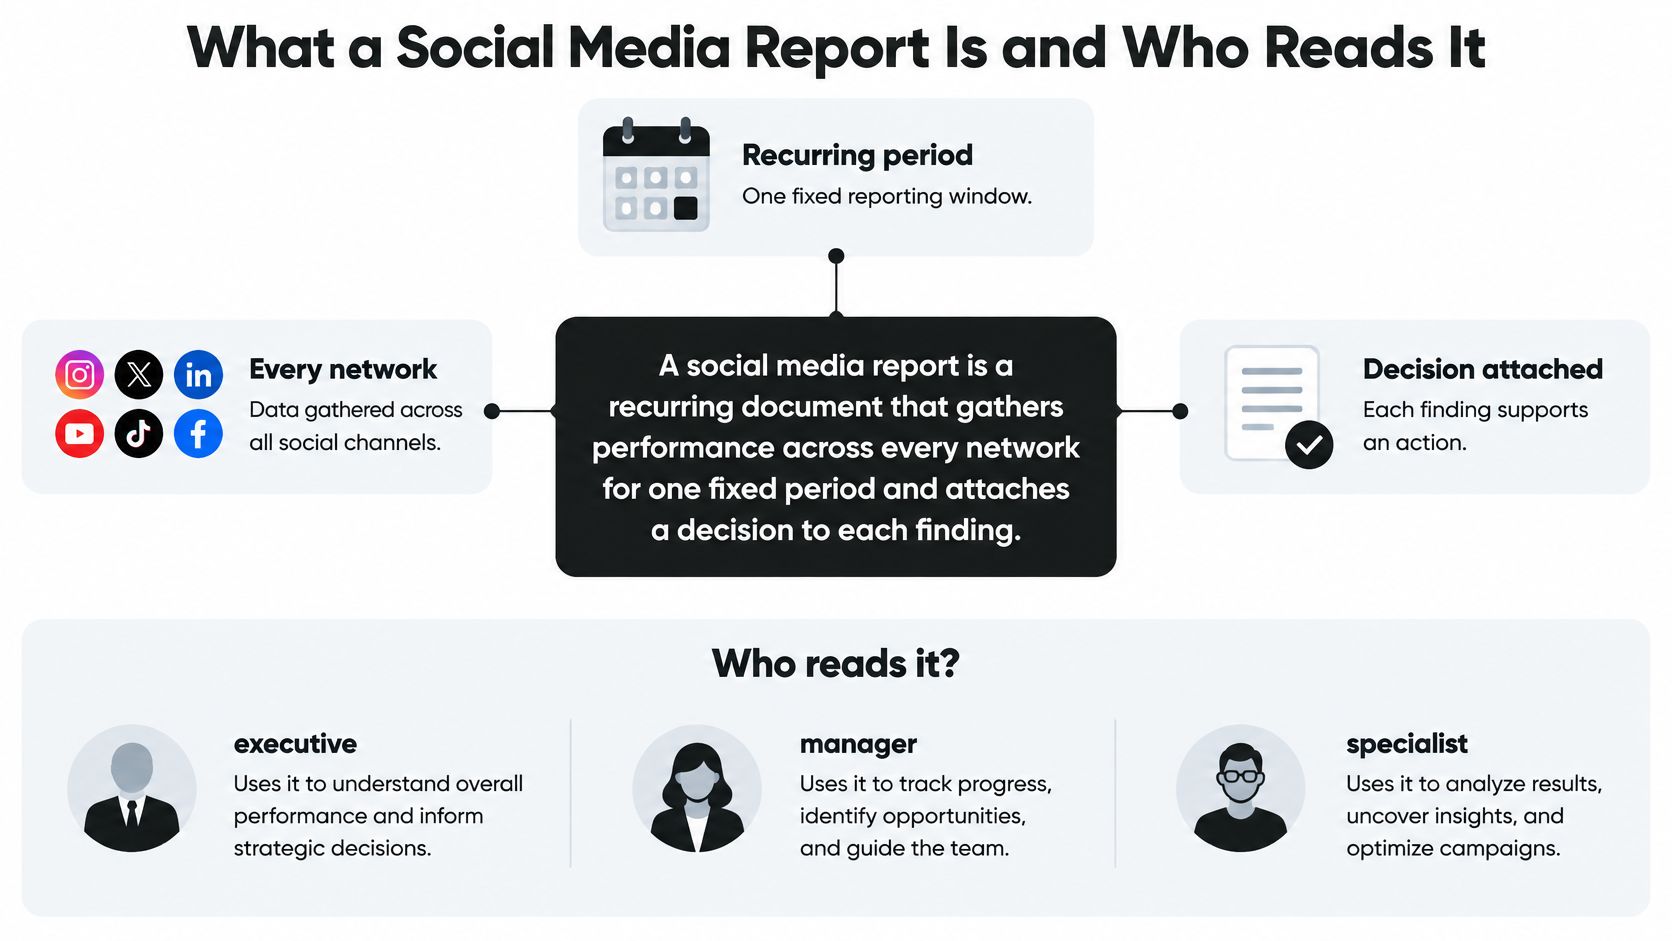
A social media report is a recurring document that gathers performance across every network for one fixed period and attaches a decision to each finding.
A dashboard is a speedometer. It shows the number right now. A report is a trip log: the route, the stops, and where to turn next. The founder checking several apps needs that context, not another screen full of totals.
Match the report to its reader
The same account activity supports different decisions:
- Solo creators need direction for next week, including which topics deserve follow-up.
- Founders need a short summary of progress against goals and the main risk.
- Clients need evidence against agreed targets, with clear measurement limits.
- Team leads need a record of what went out, when, and who approved it.
The relationship between reporting, coverage, and readers is straightforward.
Choose coverage deliberately
DataReportal's Digital 2026 Global Overview counted 5.66 billion active social media user identities in October 2025, equivalent to 68.7% of the global population, and reported that the typical user actively uses or visits 6.66 platforms each month. User identities don't map exactly to unique people, since someone can maintain multiple accounts.
For US teams, Pew Research Center's 2025 survey found that 84% of adults ever used YouTube, 71% used Facebook, and 50% used Instagram. That platform mix provides context, but the report should prioritize accounts that serve the organization's actual audience.
Coverage shouldn't mean adding every network's reach into a supposedly unique audience total. Keep account-level results visible. Otherwise, overlapping audiences can make distribution look broader than the evidence supports.
Core Metrics Every Social Media Report Should Include
A standard report can use ten core metric groups, with a fixed definition for each from month to month. Treat them as a measurement menu, not a requirement to display every available field. The main page should emphasize the measures connected to the decision.
Core social media report metrics, meaning and formulas
| Metric | What It Tells You | How to Calculate It | Platform Note |
|---|---|---|---|
| Reach | Unique people who saw a post, approximated through accounts | Count of unique accounts reached in the period | Network-defined; check each network's definition |
| Impressions | Total views or displays, including repeats | Count of all impressions in the period | Some networks count a view differently |
| Engagement rate by reach | Interaction volume relative to viewers | (reactions + comments + shares + meaningful clicks) / unique reach × 100 | Keep the same interaction list every month |
| Engagement per post | Average interactions each post earns | Total interactions / published posts | Compare within one account, not across accounts |
| Share rate | How often viewers pass content on | Shares / reach × 100 | A useful signal of content value, interpreted in context |
| Follower growth | Net change in audience | Followers at end minus followers at start | Unfollows reduce the total; use the same window length |
| Profile visits and link clicks | Intent to learn more | Report each count separately; link click rate = clicks / reach × 100 | Not reported on every network |
| Saves | Content worth returning to | Saves / reach × 100 | Available on some networks only |
| Video views and watch time | Attention on video content | Views and average watch time as reported | A view is defined differently on each platform |
| Conversions | Business outcome from social traffic | Count sign-ups or sales attributed to tagged social visits | Requires UTM-tagged links in analytics for this reporting method |
Choose measures that support the goal
For awareness, start with reach, engagement rate by reach, and follower growth. For traffic or sales, add link clicks and conversions. Saves and shares deserve emphasis when the content is intended for reference or redistribution, such as a tutorial or checklist.
Platform selection also needs context. Statlyst's social network adoption data is a useful resource for reviewing the audience environment around each channel. Adoption context helps choose coverage; it isn't a substitute for measuring an account's results.
Consider a hypothetical post that reaches 2,000 unique accounts and earns 90 reactions, comments, shares, and meaningful clicks. Its engagement rate by reach is:
90 / 2,000 × 100 = 4.5%
That's interaction volume divided by reach, not necessarily the percentage of unique people who interacted. Someone may comment and share the same post. The report should avoid claiming a unique-person response rate unless the underlying metric deduplicates those people.
Practical rule: Mark unavailable metrics as not reported, not zero. Zero means the network measured the event and found none.
Keep profile visits separate from link clicks, even when both sit under an intent heading. Someone opening a profile hasn't necessarily visited the website. A documented social media analytics tracking workflow helps keep those distinctions consistent during collection.
Why Rates Beat Raw Counts
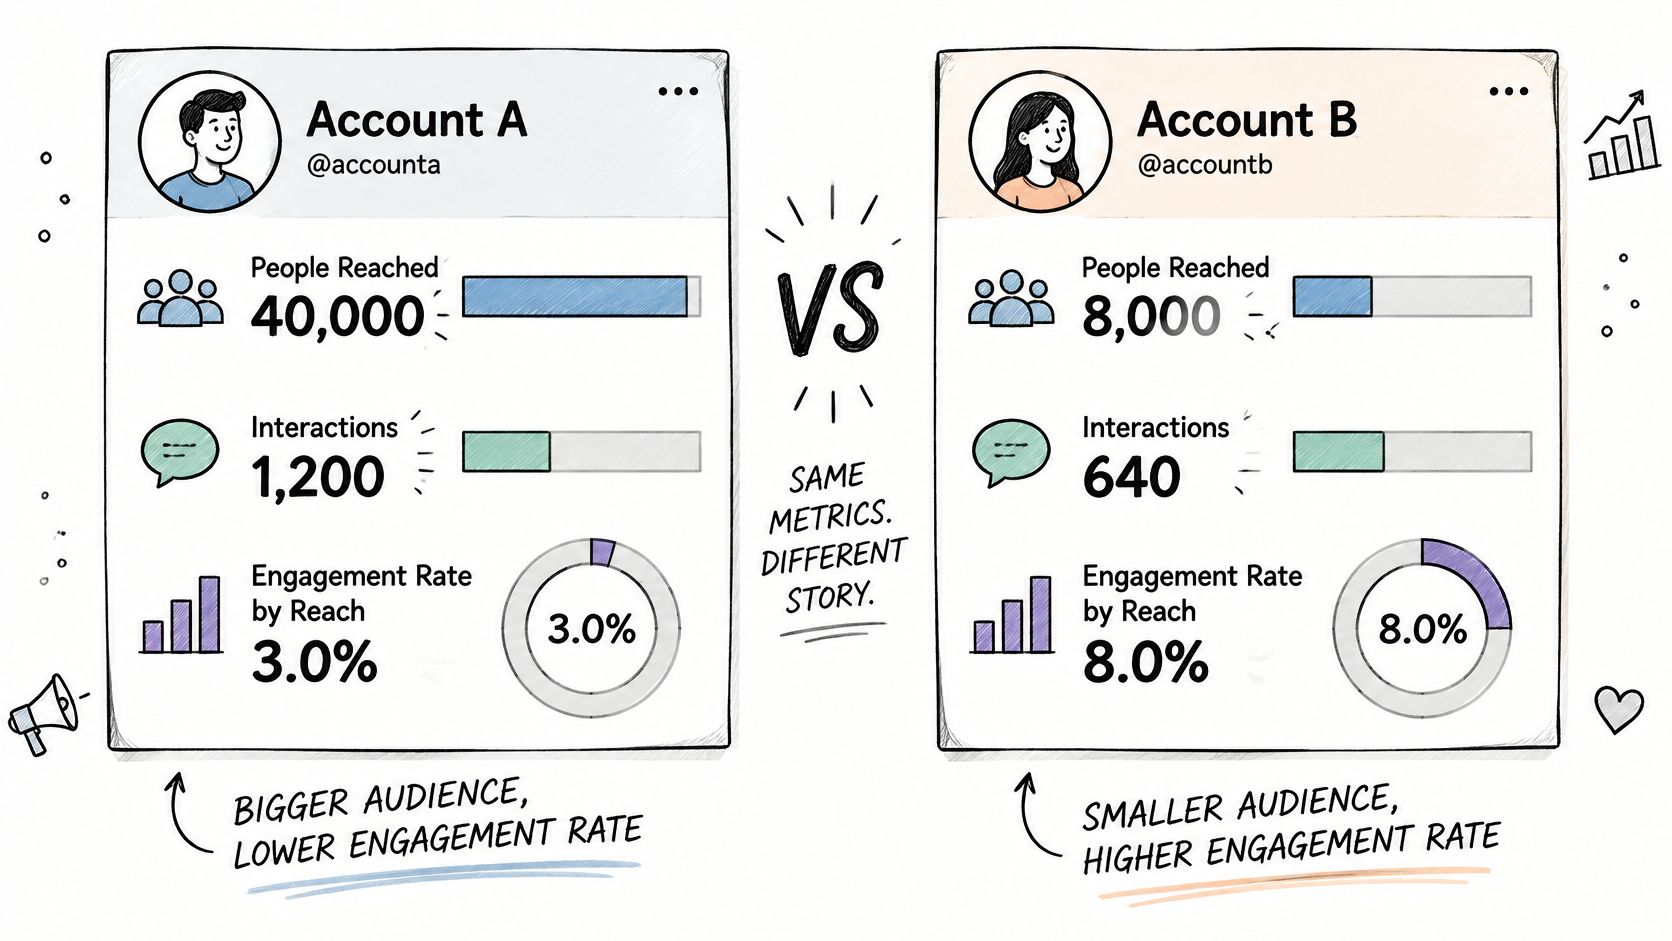
Consider two hypothetical accounts. Account A reaches 40,000 people and earns 1,200 interactions, giving it a 3.0% engagement rate by reach. Account B reaches 8,000 people and earns 640 interactions, giving it an 8.0% rate.
Account A wins on total interactions. Account B produces more than twice the interaction volume per viewer. Neither result makes the other irrelevant: one account delivers more distribution, while the other shows a stronger normalized response.
The comparison makes that trade-off visible.
Attach a denominator before comparing
Raw counts rise with audience size, publishing frequency, and platform scale. A larger account can appear more effective because more people had a chance to respond. A systematic literature review of social media engagement measurement found that 66% of examined studies relied primarily on quantitative metrics, including likes, comments, shares, and follower counts.
Keep those totals, but attach an appropriate denominator: reach, impressions, followers, or published posts. The denominator determines the question being answered. Interactions per post describe publishing output differently from interactions per reached account.
SimpleLab Digital's guide to defining conversions and eligible interactions provides useful context for choosing which events belong in a rate. An event should qualify because it represents the intended behavior, not because including it improves the result.
Platform-native definitions should stay intact. An X reply and a Facebook comment can appear under a broad interaction category without being treated as identical behaviors. A documented social media engagement rate method should specify those boundaries.
The accompanying video offers another way to approach the comparison.
Preserve the calculation history
Store the numerator, denominator, time window, platform, post type, and metric-definition version with every record. Preserve the native metric name alongside any normalized field.
If a network changes its reporting or the team changes its interaction list, mark the break in the series. Otherwise, a calculation change can pass as improved content performance. When the denominator is missing or zero, report the rate as unavailable rather than forcing a misleading result.
Build the Report Step by Step and Start This Week
Start with a repeatable spreadsheet, not a presentation template. Google Sheets or Excel can hold the source exports, calculation rules, and findings. The presentation can remain short because the supporting detail stays available.
Establish a repeatable reporting procedure
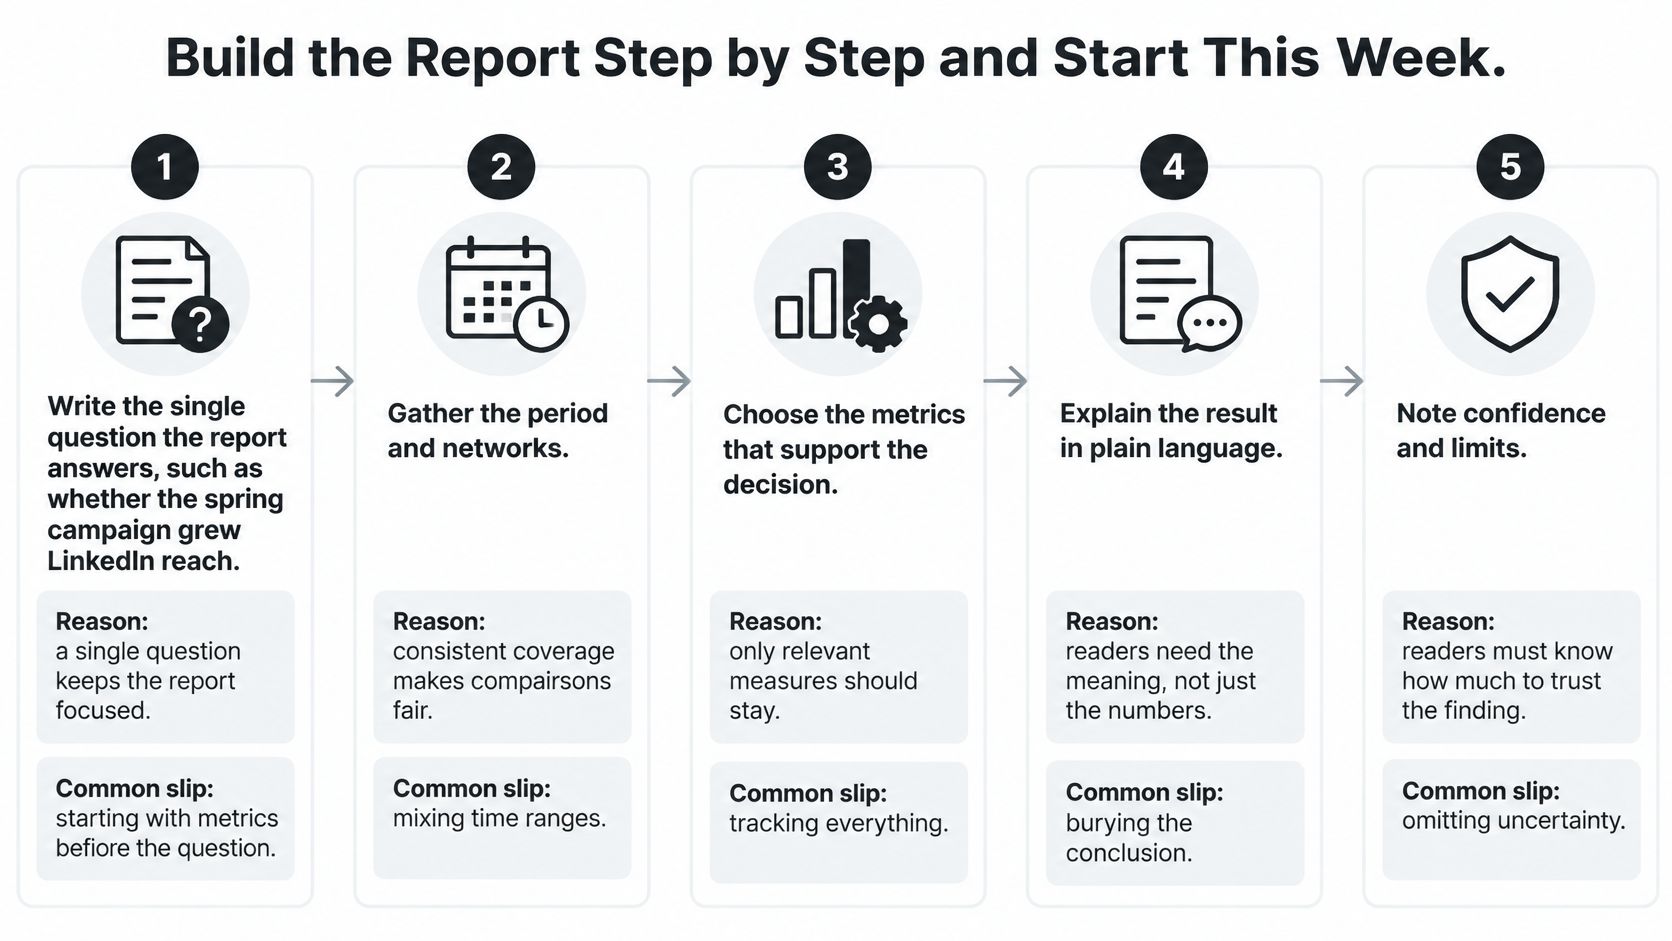
- Write the single question the report answers.
A useful question might ask whether the spring campaign grew LinkedIn reach among the intended audience. A single question keeps the report focused. The common slip is reporting every metric because it's available, before deciding what anyone needs to know. - Fix the date range and time zone.
Use the same reporting boundaries across networks, and record the export time. Consistent windows make comparisons fair. A common slip is comparing a rolling 28-day view with a calendar month, then interpreting the difference as growth. - Pull native numbers by network and post.
Keep an untouched source tab and note announced definition changes. Post-level detail makes unusual totals easier to investigate. The common slip is copying a summary screen that hides which posts contributed to the result. - Calculate rates in a separate tab.
Use formulas that reference the source cells rather than manually entering results. This makes corrections traceable. Don't round before dividing, and don't average post-level rates when the intended measure is total interactions divided by total eligible reach. - Tag every post consistently.
Add fields for content type, campaign, intended audience, and paid or organic distribution. Tags make grouped comparisons possible. The common slip is labeling only successful posts, which excludes the failures needed for an honest comparison. - Compare with a matching prior period and a fixed baseline month.
The prior period shows recent movement; the baseline provides a stable reference. Note seasonal differences. Comparing a holiday week with an ordinary week without that context can produce an unhelpful conclusion. - Write three findings with evidence, confidence, and action.
Each finding should identify what happened, how certain the explanation is, and what changes next month. The common slip is listing numbers without assigning a decision or owner. A finding isn't finished until someone can act on it.
The visual workflow keeps the main reporting tasks visible.
Keep the first version small
A practical starter report can cover one account over the last 28 days. Include reach, engagement rate by reach, follower growth, share rate, and conversions where tagged links exist. Add a trend chart, three findings, and one action for the next two weeks.
Use JoinBrands social ROI reporting tips when organizing campaign outcomes, then connect the resulting action to the team's social media content strategy. The action should change the publishing plan, not disappear into a reporting folder.
FoPost pulls post and account analytics from every connected network into one view. Advanced analytics on every account include follower growth, engagement, top posts, and best-times reports, and the data behind any report can be downloaded for a client deck.
A consolidated view can replace manual copying, but the reporter should retain the rate calculations and definitions in a controlled sheet.
Build that first page this week for the most important account, then send it to the person responsible for the next publishing decision.
Telling Real Results From Noise
Last month's best format or posting time isn't a permanent rule. A report that treats it as one can push a team toward repeating content that happened to benefit from favorable distribution.
Scholarship published in New Media & Society describes opaque and volatile algorithmic systems and the resulting algorithmic precarity for creators. That uncertainty matters when interpreting performance, but it doesn't justify blaming every decline on an algorithm.
Diagnose a drop in a fixed order
Use a consistent checklist before changing the content plan:
- Content quality: Did the topic, opening, creative execution, or call to action change?
- Audience saturation: Has the account repeated the same offer or message too often?
- Recommendation behavior: Did distribution shift between followers, nonfollowers, or platform surfaces?
- Paid competition or boosts: Did paid support stop, or did the paid distribution environment change?
- Moderation: Were posts removed, restricted, or made ineligible for recommendation?
- Measurement: Did collection fail, permissions expire, or the network change a definition?
Say reach falls 30% in a hypothetical week. Check the post mix first. A week dominated by product announcements shouldn't be treated as equivalent to a week of broad educational videos.
Next, inspect the boost log. Then check whether the network changed how it counts reach. If the evidence doesn't isolate a cause, label the explanation as unresolved rather than writing that the algorithm reduced visibility.
Set a threshold before declaring a winner
As a working reporting policy, compare results against at least three prior periods and show the observed range, not just the latest number. Segment benchmarks by account size and market before applying them elsewhere. A result from a different language, audience, or platform surface may not transfer.
A small team might require five comparable posts before calling a format promising. That's an operating threshold, not a statistical guarantee. State it in the report, and increase the sample when results remain inconsistent.
Diagnostic boundary: A historical range describes past variation. It isn't automatically a confidence interval or a forecast.
Prepare a short response plan for sudden distribution changes. Name who checks account status, who verifies collection, and who can adjust the publishing queue. Keep established content running while testing a limited alternative, unless moderation or brand risk requires a pause.
Separate platform-controlled indicators, such as reach, from business outcomes, such as qualified inquiries. A visibility decline deserves attention, but the operational response should depend on whether the outcomes the team needs also deteriorated.
How to Present Findings and Their Limits
A founder may need to decide whether to keep funding a campaign. A creator may need to choose the next topic. Open the report with that decision, then provide enough evidence to support it without disguising uncertainty.
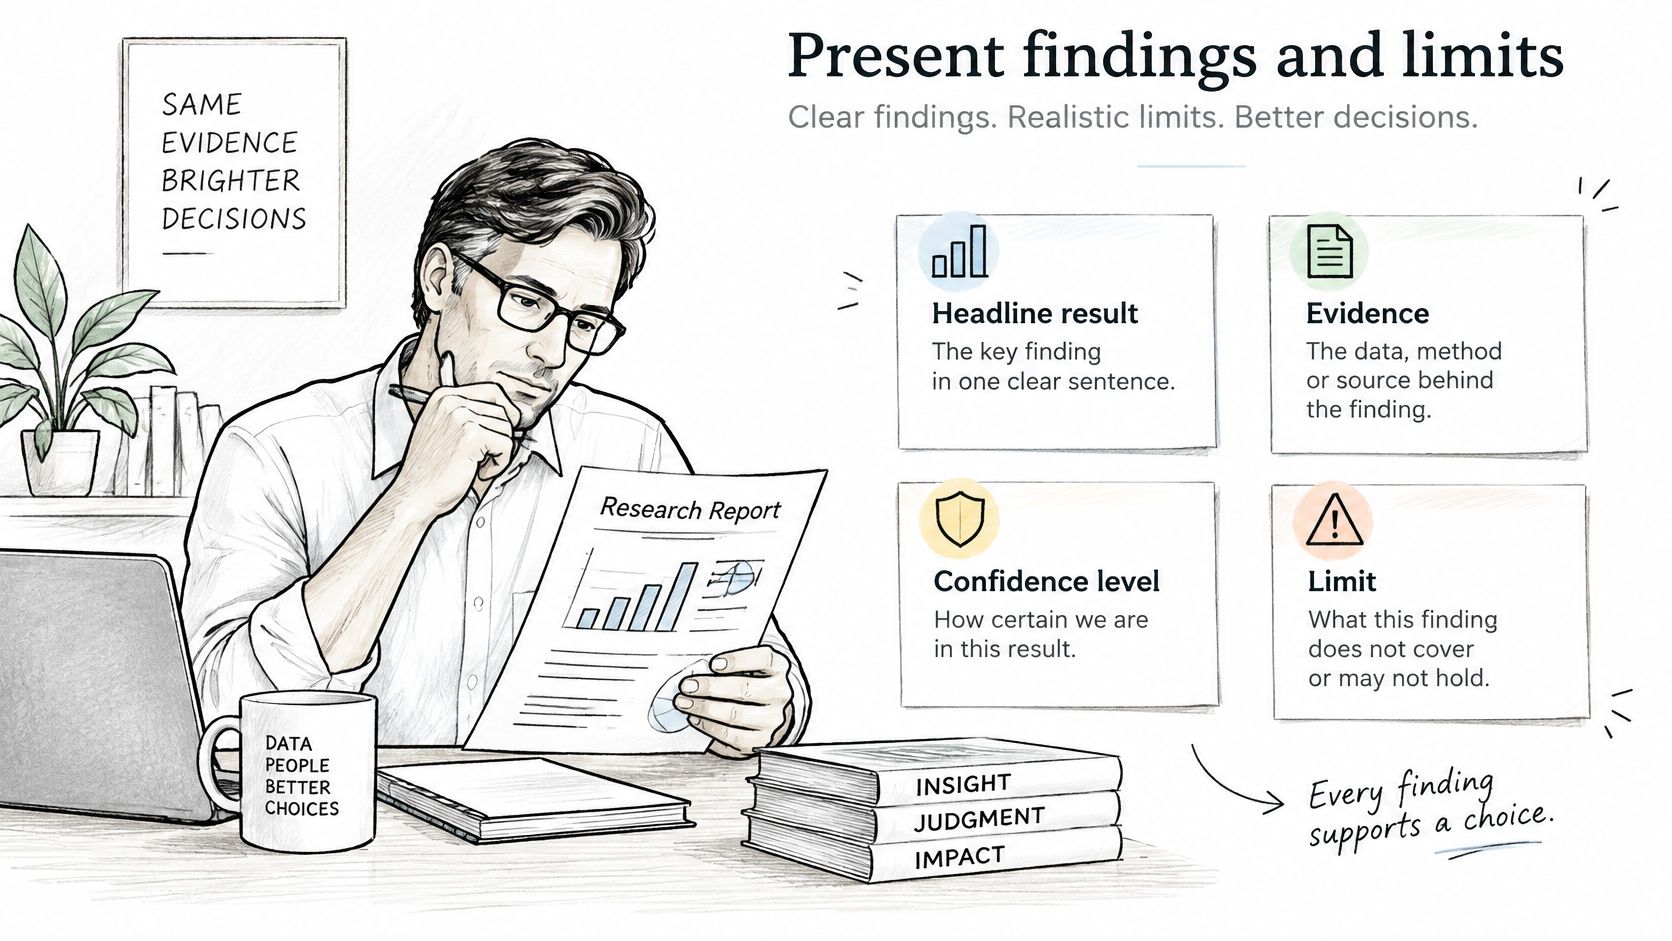
Structure every finding around the headline result, evidence, confidence level, and action. The reader shouldn't have to infer which part is measured and which part is an explanation.
Separate the result from the explanation
A hypothetical finding could read:
Reach rose 18% during the spring campaign. Tagged-link analysis places the campaign's share of measured website traffic between 9% and 14%, depending on the attribution rule. Confidence is moderate that the campaign contributed to the reach gain, but its exact contribution remains uncertain. Continue the strongest campaign topic and improve link tagging before expanding production.
That range needs an explicit method. In this example, it represents different attribution rules, not a statistical confidence interval. Link clicks alone also don't establish what caused the reach increase.
The measurement problem is substantial: the Sprout Social 2025 Impact of Social Media Report reports that only 44% of marketing leaders rate their social team as expert at measuring business impact and cites Nielsen's finding that only 32% of marketers worldwide measure digital and traditional media holistically.
Clear presentation puts interpretation beside the evidence, rather than hiding caveats in an appendix.
Distinguish contribution from causation
Keep these outcome categories separate:
- Exposure: The platform displayed the content.
- Interaction: Someone reacted, commented, shared, or clicked.
- Assisted conversion: Social appeared in a recorded path before a sign-up or sale.
- Incremental lift: A credible comparison estimates outcomes that wouldn't have occurred without the activity.
Platform-reported conversions aren't proof of incremental lift. State the attribution window, model, and known tracking gaps. Connect website analytics with CRM records where possible, and label offline outcomes that can't be reliably matched.
Use high, moderate, or low confidence as editorial labels with written reasons. Don't turn those labels into invented probabilities.
Report format by audience
The following formats and lengths are practical starting points, not mandatory standards.
| Audience | What They Need | Format | Length |
|---|---|---|---|
| Solo creator | Weekly direction on what to post next | One-page summary with three findings | One page |
| Founder | Growth against goals and the main risk | Dashboard snapshot with a short written summary | One page |
| Client | Proof of outcomes against agreed targets | Slide deck with trend charts and a definitions appendix | 6 to 10 slides |
| Team lead | What went out, when, and who approved it | Shared sheet with one row per post | Ongoing |
| Developer or operations lead | Failed posts, publishing success rate, and API limits hit | Exported data with a schema note | As needed |
Keep the opening recommendation short. Put calculation definitions, collection failures, and attribution assumptions where specialists can inspect them. A polished chart should make the evidence easier to understand, not make uncertain conclusions look certain.
FoPost offers scheduling and publishing to every major network from one place, with AI assistance and APIs and SDKs for developers. Visit FoPost to connect the publishing workflow with account measurement, then build a first reporting page around one account and one decision.