

The most popular advice about social media engagement rate is to find a benchmark and beat it. That's a poor place to start. A percentage can fall because fewer people saw your content, because more people saw it repeatedly, or because the report changed what it counts.
Read the rate beside reach before judging the creative. Then check the calculation. The important question isn't whether engagement went up or down. It's whether the people who encountered your post responded, and whether their response helped you achieve your goal.
Three Formulas and Choosing the Denominator
Social media engagement rate is interactions divided by a chosen audience base, multiplied by 100. The interactions go on top of the fraction. The audience base, called the denominator, goes underneath.
The common choices are followers, people reached, and impressions. Buffer's engagement-rate guide describes these different bases and the widely used impressions formula, which divides total interactions by total impressions and multiplies by 100.
Engagement rate formulas and what each one answers
| Method | Formula | Question it answers | Where it misleads |
|---|---|---|---|
| Follower rate | (interactions ÷ followers) × 100 | How the accumulated audience responds | A large follower base can make a strong post look weak |
| Reach rate | (interactions ÷ people reached) × 100 | How people who actually saw the post responded | Reach definitions differ by network |
| Impressions rate | (interactions ÷ impressions) × 100 | Response per view, including repeat views | Repeat exposure lowers the rate without fewer people acting |
Run the same post through each formula
Say a hypothetical post earns 400 interactions. The account has 20,000 followers, while the post reaches 8,000 people and receives 12,000 impressions.
The calculations produce different answers:
- Follower rate: (400 ÷ 20,000) × 100 = 2.0%.
- Reach rate: (400 ÷ 8,000) × 100 = 5.0%.
- Impressions rate: (400 ÷ 12,000) × 100 = about 3.3%.
None is a math error. Each describes the same activity against a different base.
The follower calculation compares the interactions with the account's accumulated audience. It doesn't prove that those interactions came from followers, because nonfollowers may also encounter the post. Treat it as an audience-size benchmark, not a count of participating followers.
The reach calculation uses unique people exposed to the content. But interactions aren't necessarily unique people. Someone can like, save, and comment on the same post, so a reach-based rate isn't automatically the percentage of viewers who participated.
The impressions calculation includes repeated exposure. Someone who encounters the post again contributes another impression without necessarily taking another action. That makes this a measure of response per display, rather than response per unique person.
Decide what counts as an interaction
Common numerator items include likes, comments, shares, saves, and clicks. Don't assume every network or analytics tool includes the same combination.
A systematic review of social media engagement measures documents normalization against posts, followers, and reached users, alongside platform-specific differences in the actions included. That's why a platform's ready-made engagement percentage may not match your spreadsheet even when both calculations are correct.
Keep the component actions separate before adding them together. If your objective is useful content people want to keep, inspect saves. If you want visits to a product page, inspect clicks rather than treating every interaction as equally relevant.
For an Instagram-specific walkthrough, Gainsty's guide to measuring Instagram performance is a useful companion when you're checking how your report defines the calculation.
Reporting rule: Write the denominator, included actions, and measurement window beside every engagement rate.
Match the denominator to the decision
Use a follower-based rate for audience-level comparisons over time. Record which follower count you used, especially if the audience changed during the reporting period. Otherwise, audience growth can change the percentage even when interaction totals hold steady.
Use reach or impressions to examine a particular post's response after exposure. Reach is useful when your question concerns unique viewers. Impressions are useful when repeated displays are part of what you're evaluating.
Finally, keep the observation window consistent. A post measured shortly after publication and another measured after a much longer period haven't had equal opportunities to collect interactions. Label that window before deciding which performed better.
Platform Benchmarks From 2024 to 2025
Median engagement rate by platform, January 2024 to January 2025
The following figures come from Buffer's comparison of median engagement in January 2024 and January 2025, with changes expressed in percentage points.
| Platform | January 2024 | January 2025 | Change in points |
|---|---|---|---|
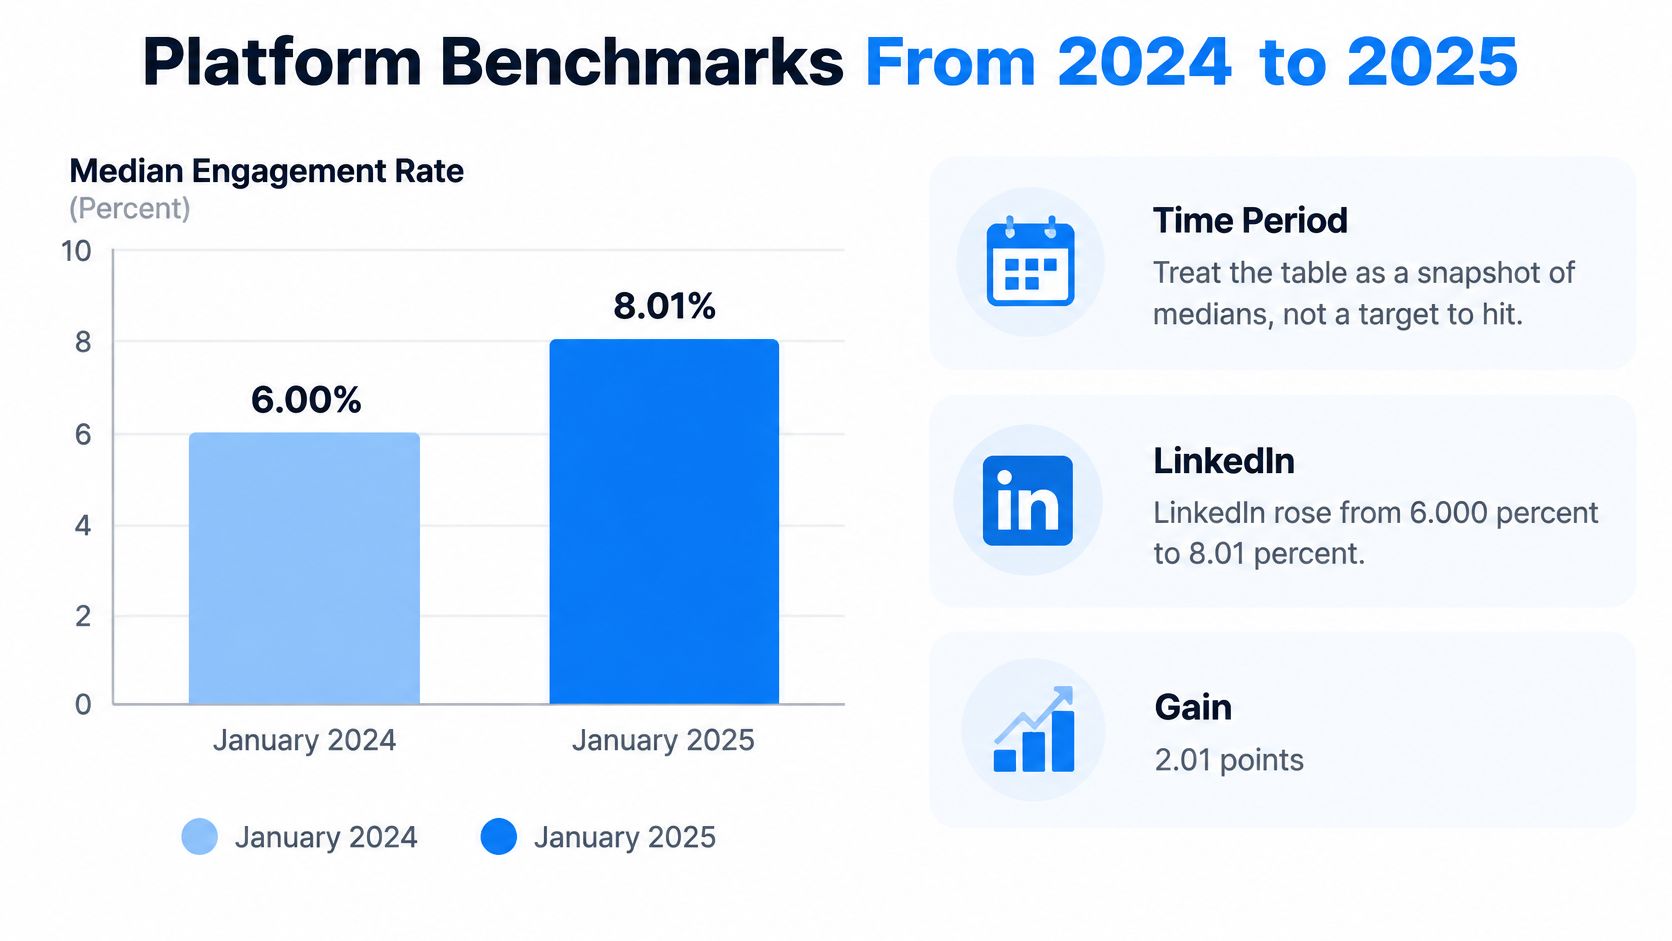
| 6.00% | 8.01% | +2.01 | |
| 2.94% | 0.61% | -2.33 | |
| TikTok | 5.14% | 4.56% | -0.58 |
| Threads | 4.76% | 3.60% | -1.16 |
| YouTube Shorts | 3.95% | 4.71% | +0.76 |
| 3.08% | 5.26% | +2.18 | |
| About 5.45% | About 5.45% | Approximately 0.00 | |
| X | 3.47% | 2.15% | -1.32 |
Treat this table as a historical snapshot of medians, not a target to hit. A median identifies the middle of the measured distribution. It doesn't tell you what your particular audience, business, or content format should achieve.
The LinkedIn comparison makes the time period especially clear.
Read the movement, not just the ranking
LinkedIn finished with the strongest median in this dataset, while Instagram experienced one of the sharpest declines. Pinterest also showed a substantial upward movement. Those differences make a universal good engagement rate difficult to defend.
Don't interpret a change in percentage points as the same thing as a percentage change. The table subtracts the earlier rate from the later rate. It doesn't calculate relative growth.
Nor should you conclude that the teams publishing on a rising platform suddenly became better writers. Algorithms, audience behavior, formats, and distribution conditions all affect the results. Publishing frequency alone can't explain the pattern.
Build a fair comparison group
Start with your own posts on the same network. Narrow the comparison to similar formats and a comparable posting period, then check audience size and whether distribution was paid or organic.
For a professional account, ViralBrain's overview of LinkedIn analytics tools can help you evaluate reporting options for that network. For Instagram workflows, keep an Instagram-specific reference separate from your professional-network reporting.
A benchmark should prompt a question, not issue a grade. If your results moved against the platform trend, investigate the difference. If they moved with it, avoid giving your latest caption all the credit or blame.
A blended cross-network rate can hide improvement on one platform and deterioration on another.
Keep network-specific results visible even when management wants a single summary. The summary is useful for orientation. It isn't a fair basis for deciding which channel's creative needs changing.
A Falling Rate Is Not Always Weaker Content
A lower engagement rate isn't enough evidence to call the creative weaker. First establish whether the post received a comparable opportunity to earn attention.
Look beyond the headline percentage when reviewing a performance dashboard.

A Captapi analysis of engagement metrics describes a 2025 analysis of nearly 5.7 million videos from more than 582,000 accounts worldwide that found engagement, likes, and reach declining together; it also cites 2025 research in which 56% of surveyed marketing leaders believed social media drove revenue, while 44% considered their teams expert at measuring business impact.
Those findings raise separate problems. Distribution conditions can depress multiple metrics at once. Meanwhile, confidence that social matters commercially doesn't necessarily mean a team can connect post-level activity to business results.
Use reach to separate the explanations
Read the pattern before choosing an intervention:
- Reach falls, reach-based rate stays stable: The remaining viewers are generating interactions at a similar rate. Investigate reduced exposure before replacing the creative.
- Reach holds, reach-based rate falls: The post had a comparable audience opportunity but generated less response. Inspect the opening, format, relevance, and offer.
- Reach and reach-based rate both fall: Investigate distribution and audience response together. Changing the caption alone may not address either problem.
These are diagnostic clues, not controlled experiments. A stable rate can conceal a change in who saw the post. Your loyal audience may respond differently from unfamiliar viewers, so inspect audience composition where it's available.
For a visual explanation alongside your own dashboard review, use the video below.
Separate attention from business value
Pair engagement rate with absolute reach, impressions, watch time, saves, shares, comments, and conversions. Segment the results by platform, format, audience size, and posting period.
Give each metric a job. Watch time helps you examine whether viewers stayed. Saves and shares help you understand what they found worth keeping or passing along. Conversions help establish whether the attention led to the action your business needed.
Don't optimize for a higher rate at any cost. Restricting content to a smaller, familiar audience could improve the percentage while reducing discovery and useful visits. The better publishing decision may involve a lower rate alongside broader relevant exposure and stronger downstream results.
When the Algorithm Moves the Rate
Distribution can change interaction totals without any improvement in the writing. A peer-reviewed study of German newspaper tweets found that Twitter's shift from reverse-chronological ordering to algorithmic selection was followed by a 20% increase in likes and a 15% increase in retweets within 30 days.
Read that carefully. The study measured interaction counts, and counts alone can't show whether the engagement rate rose. Without the exposure denominator, response per impression stays unknown. More likes may mean more people saw the post.
Record the conditions around publication
Ranking systems weigh signals such as prior engagement, timeliness, and popularity when selecting content. When a post attracts early interaction, the system may show it more widely, and that additional visibility can produce further reactions even when the creative is unchanged. The rate moves. The post didn't.
Keep these fields beside the reported rate:
- Impressions and reach: Record both where available, rather than substituting one for the other.
- Posting time: Include the time zone so scheduled posts can be compared accurately.
- Format: Distinguish a text update from a document, video, or image.
- Early interaction timing: Note how quickly the first responses arrived, since fast early engagement is one of the signals that can trigger wider distribution.
- Distribution context: Record paid support, collaborations, or unusual external attention.
With those fields logged, a rate change becomes legible. A post whose impressions doubled because a collaborator shared it shows a different pattern from one where reach stayed flat and interactions climbed. The first case is a distribution story. The second may be a content story.
Audience conversations add context that a percentage can't provide, so read comments and replies alongside quantitative analysis when you're investigating whether a topic became more relevant or contentious.
Test changes without claiming too much
When testing a caption style, repurposed article, or scheduling change, choose a matched comparison period or retain a holdout group that continues the existing approach. Keep network, format, audience, and paid support as similar as practical.
Change one variable at a time. If you revise the headline, switch the format, and move the publishing time in the same week, you may improve the outcome without learning which intervention deserves credit.
A higher rate may reflect better content, greater algorithmic amplification, or both.
Write conclusions at the level your comparison supports. Say the revised posts performed better under the observed conditions. Claim the wording caused the improvement only when the test separated wording from distribution and every other change.
Two Posts That Are Not Equal
Consider a hypothetical local shop and a hypothetical national brand. Each publishes a post that earns 80 interactions, but their audiences and exposure totals differ sharply.
The local shop has 2,000 followers. Its post reaches 1,500 people and receives 2,200 impressions, producing a 4.0% follower rate, an approximately 5.3% reach rate, and an approximately 3.6% impressions rate.
A small account with broad exposure
The local shop's post reached a number of people close to the size of its follower base. Its follower rate is a useful shorthand for this example, though it still doesn't establish that the viewers were followers.
The national brand has 200,000 followers, while its post reaches 40,000 people and receives 90,000 impressions. The same interaction total now produces a different picture.
Same 80 interactions, two account sizes
| Metric | Case B (200,000 followers) |
|---|---|
| Follower rate | 0.04% |
| Reach rate | 0.20% |
| Impressions rate | About 0.09% |
The follower denominator explains part of the contrast, but not all of it. The national brand also received substantially more exposure without collecting more interactions. In this scenario, audience size alone isn't a sufficient explanation for the weaker response per exposure.
Still, these numbers don't establish which creative treatment would work better for the other account. The audiences, expectations, and distribution conditions differ. A fair creative test would need closer matching.
The post that looks quiet until you count saves
Now consider a hypothetical Reel with 20 likes, 5 comments, and 400 saves. Counting only likes and comments gives 25 interactions; including saves gives 425 interactions.
If that Reel has the most saves among the week's posts, it deserves consideration for repurposing into a checklist or carousel. The action mix suggests viewers wanted to keep it. That's a useful editorial clue, not proof that it generated sales.
A total alone can't tell you whether people applauded, debated, bookmarked, or visited a page. Keep the action breakdown visible when choosing what to make again.
Don't mistake a tiny base for a durable result
In another hypothetical example, 10 likes on an account with 100 followers produces a 10% follower rate. If the account later has 1,100 followers and the likes remain unchanged, that rate becomes approximately 0.91%.
That calculation doesn't predict the account's future performance. It shows how sensitive a small denominator can be.
Before declaring a recent post the winner, calculate its follower-based and reach-based rates. Then inspect the actions behind the total and decide whether they match the post's purpose.
Measure One Rate and Review It Monthly
Choose a primary rate for each network so your reporting has a stable starting point. Keep alternative calculations available for diagnosis, but don't switch your headline metric whenever another formula produces a more flattering result.
A spreadsheet can support this routine. Create separate columns for the raw counts, calculated rate, denominator, format, campaign label, and observation window.
Set up a repeatable review
- Name the primary rate. Write reach-based, impressions-based, or follower-based beside the percentage. Add a short definition of the included interactions so another person can reproduce it.
- Preserve the raw fields. Store likes, comments, shares, saves, clicks, impressions, reach, and followers separately. Treat unavailable metrics as missing, not as zero.
- Choose the comparison group before ranking posts. Filter by network and format, then consider audience size and posting period. Use external medians as context rather than a pass-or-fail threshold.
- Investigate exposure before commissioning a rewrite. Inspect absolute reach and impressions when a result drops. Assign the next action to the likely problem, whether that's distribution, audience relevance, or the creative treatment.
- Review labeled posts monthly. Look for patterns across topics and campaigns instead of rebuilding the content plan around an isolated result. Record what you'll test next and what outcome would justify keeping the change.
Turn the review into an editorial decision
Our analytics workspace brings network-specific reach, engagement, and follower change together for connected accounts, with trends over a chosen date range and campaign roll-ups by label. Your team still needs to apply meaningful labels and define the comparison rules.
End each review with a concrete decision. Keep a format that consistently supports the intended action, revise a topic that attracts attention without useful follow-through, or test a distribution change when relevant posts aren't reaching people.
Start by relabeling last month's posts with their denominator and observation window. Resolve inconsistent calculations before changing the editorial plan. A clean comparison is more useful than a confident explanation built on mismatched percentages.
FoPost lets you create, adapt, schedule, publish, and measure content across connected social accounts in a shared workspace. Visit FoPost to bring publishing and performance review together, then use your next monthly review to compare engagement with reach rather than judging either number alone.